A listener asks an excellent question:
Can top growth stocks really go truly out of style?…I started with a diversified portfolio that eventually went the way of FAANG; however, over the past 3-4 years I’ve gravitated around the highest growth companies out there…If a company is producing a growth rate at +40% even during down turns in the market or a more “value oriented” time in the market, isn’t that company still going to get a premium and would it still make sense to own those plays?
The short answer is yes. Growth stocks, even top ones, can go out of style.
When I started to think about what this post would look like, my thesis was that these high-fliers could continue to grow their business, but if the shares have already reflected all of that growth, then any whiff of a slowdown and these stocks would get whacked. I then went looking for historical comparisons to support my conclusions.
The dot-com bubble is a natural place to look in terms of growth markets that compare to today.
I thought about Microsoft as the poster child of a growth stock that got killed even as the business continued to grow. Indeed, Microsoft was a much larger company a few years after the wipeout, even though its market cap said otherwise. But like nearly all tech companies, Microsoft’s business was impaired, if only temporarily, after the bubble burst. More on this later. Before we go back to the future, let’s take a look at the present.
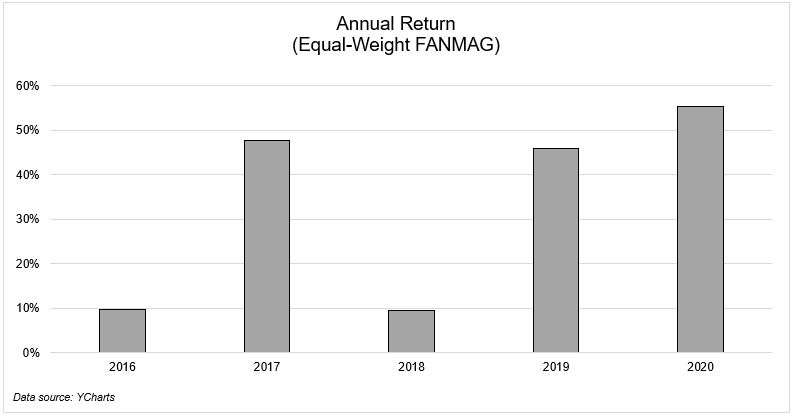
The FANMAG stocks have been the biggest and best performing growth stocks for a long time now. Over the last five years, an equal-weighted basket of them, rebalanced annually, gained 300%, or 30% annually!
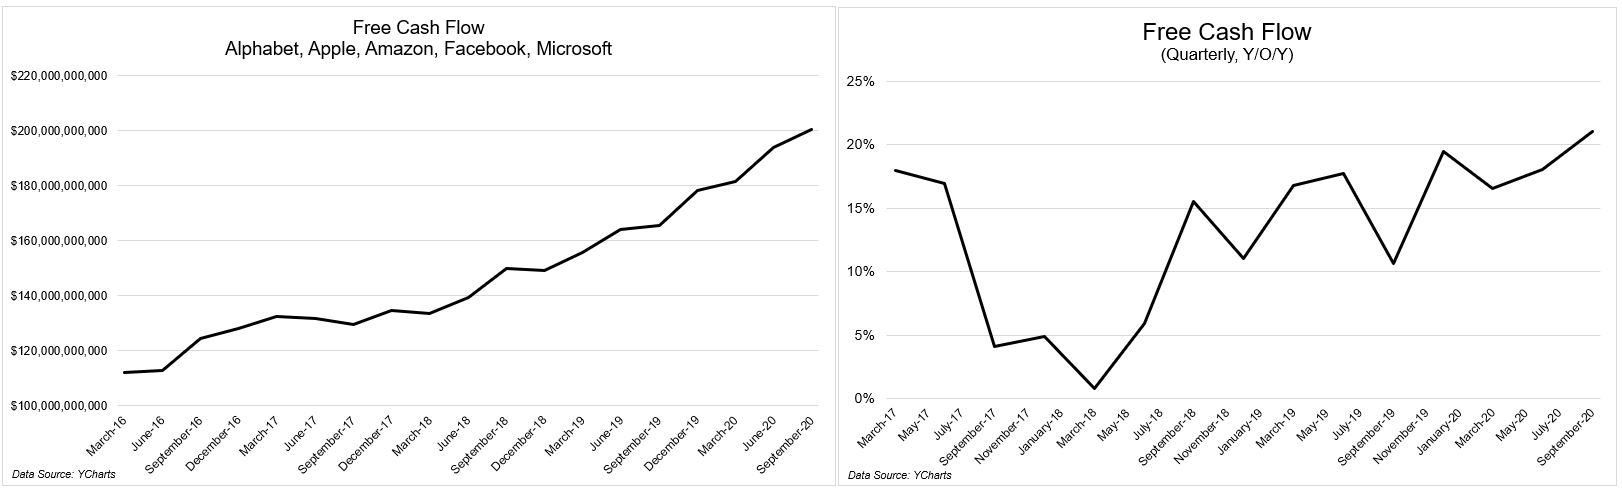
The appreciation in share prices was not just the result of naive investors chasing past performance. Fundamentals beat even lofty expectations time and time again. These six businesses’ free cash flows just crossed $200 billion in the most recent quarter and have compounded at 13% for the last 5 years. (I excluded Netflix because their free cash flow was negative up until the most recent quarter). On a per-share basis, free cash flow has compounded at 20%, presumably driven by the massive share repurchases.
I want to take a second and recognize how insane this is. I can’t say with certainty, but I would guess that we have never seen stocks at the top of the food-chain growing like this. Size, which was once thought to impede growth, has turned into HGH for management teams.
The email indicates that this person has already moved away from the giants and into the next generation of growth stocks, so let’s look at what’s going on there. These businesses are each lighting the world on fire, as are their stocks.

Each of these companies is in the “you don’t understand” bucket.
- You don’t understand. These companies are smarter and more efficient than ever.
- You don’t understand network effects.
- You don’t understand winner take most dynamics.
- You don’t understand how low interest rates make long-duration assets more valuable today.
- You don’t understand that these stocks are actually cheap based on their growth rates.
I don’t want to be completely dismissive of this attitude. Time will reveal the truth, one way or the other. My prediction non-prediction is that there will be winners and losers. Some will grow into their multiple while others will disappoint.
One of the things that have people seeing 1999 deja vu is the explosion of negative earners. This isn’t an accident, they’re still ramping up, and investors are accepting that. Not only are they accepting it, but they’re also encouraging it. Look at this chart!

These businesses are growing fast, and their share prices are growing even faster. We’ve seen this prequel before. The last time we had a hyper-growth phase in the market, investors got completely carried away. Stocks flooded the market, and valuations stretched into the stratosphere. Sound familiar?
I turned to my friends at O’Shaughnessy asset management for some tech data to see what happened to the sector as the bubble was inflating and after it burst.
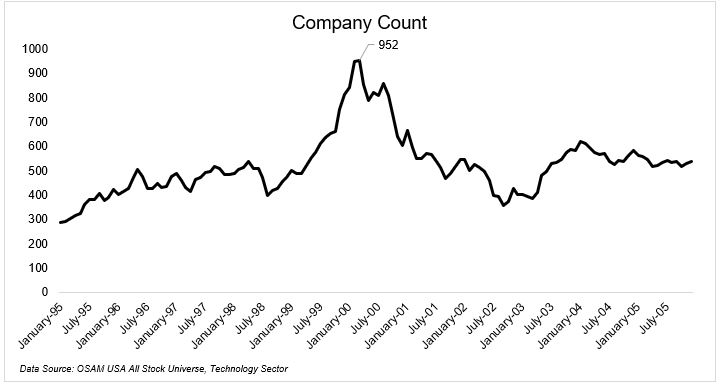
The number of tech stocks exploded from under 300 at the beginning of 1995 to 952 at the bubble’s peak. And this does not include god knows how many penny and microcap stocks that came public. All of the data in the following charts are pulled from OSAM’s all-stock universe, which you can think of as a proxy for the Russell 3000.
The market was flooded with new issues because investors demanded them, and investors demanded them because prices kept going up and up and up.
The stocks were equal parts reality and insanity. The rational part that drove prices higher is that the internet was changing the world. The irrational part was that investors thought no price was too high.
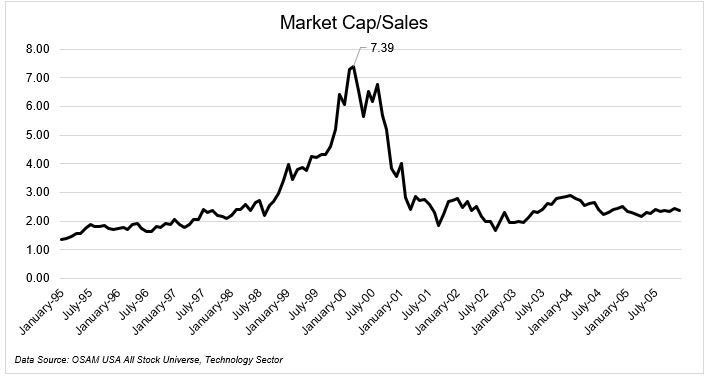
Revenue in these companies more than doubled from 1995 to 1999, growing from $323 billion to $767 billion. But the sales growth was dwarfed by the growth in market cap. Investors were paying just over 1x sales when the bubble began inflating and reached 7.4x at the peak.
Investors were bidding up stocks as if growth was going to continue forever, and when that didn’t come to fruition, they all got killed.

So what happened to the fundamentals after the bubble burst? It’s not so black and white. This, as they say, in the eye of the beholder.
Let’s start with revenue.
By the time sales peaked in July 2001, tech had already lost 60% of its market cap. Sales declined by 24% and took 5 years to break even.

Net income paints a darker picture. This is a full-blown crash. 
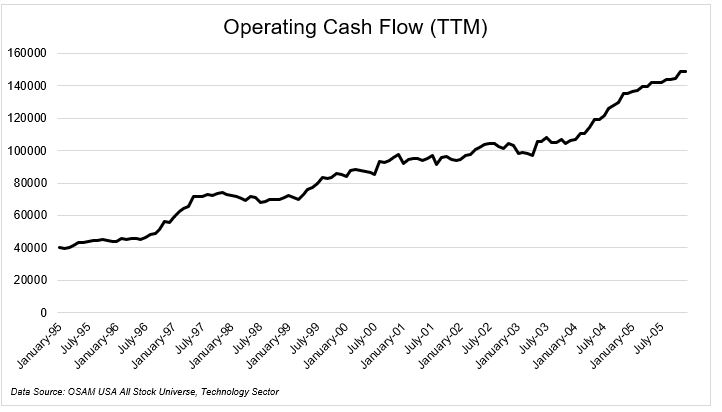
And if you look at operating cash flow, you wouldn’t suspect any problems whatsoever.
Like I said, not so black and white. But what is not up for debate is that investors got too far out over their skis.
Now that we saw what happened from the bleachers let’s look at what happened to some of the players on the field.
- Microsoft fell 65% and took 17 years to get back to even.
- Amazon fell 95% and took 10 years to get back to even.
- Qualcomm fell 58% and took 21 years to get back to even.
- Intel fell 82% and still isn’t back to even.
- Cisco fell 89% and still isn’t even close to back to even.
Intel, Cisco, and Microsoft were enormous companies in the late 90s. At one point, each of them was worth over $500 billion ($775 in today’s dollars). Amazon, the only one of these five that never saw negative growth, was a peanut compared to these giants. Its market cap peaked at $36 billion ($56 in today’s dollars).
I want to take a second to talk about how Amazon grew and contrast that with what happened to their stock.
Amazon continued to grow between the peak in 99 through the end of 2002. Their quarterly revenue growth averaged a whopping 48%! On the other hand, their free-cash-flow, the lifeblood of any company, went from $2.8 million in December of 1998 to -$500 million in September 1999 to a low of -$688 million in March of 2000.
Growing your top line while hemorrhaging money works in some environments. Stock market meltdowns are not one of them.
Amazon’s stock fell from a peak of $113 to a low of $5.51. That means that from the peak, it got cut in half, then it got cut in half again, and then it got cut in half a third time, and then, you guessed it, it got cut in half again. And then it lost another 22% for good measure. So the next time you see somebody say, “If you invested $10,000 at Amazon’s IPO,” you can safely dismiss the second part of their statement.
And as a reminder, Amazon’s penetration into our lives and its march to domination continued all the while. Of course, there are hundreds of companies who never made it out alive.
By the time Amazon made another all-time high, ten years had passed, and it had transformed itself into a gigantic business.
At its peak in 1999, Amazon did $1.64 billion in TTM revenue. By the time its stock was back at all-time highs in 2009, it had done $21.69 billion in revenue.
At its peak in 1999, Amazon had -$378 million in free cash flow. By the time its stock was back at all-time highs in 2009, it had $1.915 billion in free cash flow.
The chart below tells the story of the stock versus the business.

Microsoft’s trajectory looks similar to Amazon’s. Revenue kept growing, free cash flow took a short-term hit, and by the time it got back to all-time highs, it was a much, much larger company.
The other three companies got hit along with the rest of the tech sector.
Intel’s revenue fell 23% y/o/y. Free cash flow fell 63%.
Cisco’s revenue fell more than 30% y/o/y. Free cash flow fell 40%.
Qualcomm’s revenue fell more than 40% y/o/y. Free cash flow fell 43%.
So yes, growth can go out of style.
Even if a business grows, a business owner can still lose money or worse if they pay too much for it. How do you know if you’re paying too much? Heck if I know.
Howard Marks recently wrote, “The basic equations of finance were not built to handle high-double digit growth as far as the eye can see, making the valuation of rapid growers a complicated matter.”
Here are a few possible scenarios that could play out:
- If growth continues or accelerates, these stocks will be meaningfully higher in the future. That’s not to say there won’t be drawdowns, but absent the bursting of a bubble, a catastrophic drawdown is unlikely. Should growth continue, I would expect long-term investors to be handsomely rewarded.
- If growth decelerates for whatever reason, these stocks will get beat up. From here, two paths can follow: They approach a steady growth state, and shares are re-rated higher, assuming it’s still well into the teens. The other potential path is growth slows to single digits, and these stocks get cut in half.
- If growth slows and turns negative, these stocks get murdered and never recover.
I am somewhere between the first and second bullet points. I don’t think triple-digit growth can continue for very long. I don’t think anybody expects it to, for that matter. The question is, how does the market react if and when the growth curve flattens.
We may look back on this environment and wonder how we fell for it again. And even though some people think they’ve seen this movie before, that doesn’t mean they know how the sequel ends.
Maybe it’s different this time. Maybe it’s exactly the same.

