No strategy works all of the time. Things go in and out of favor. Over the last year, the sun has set on min-vol strategies.
I was thinking about this today while reading this excellent piece from Robin Wigglesworth. He describes the history of this strategy, and where they stand today.
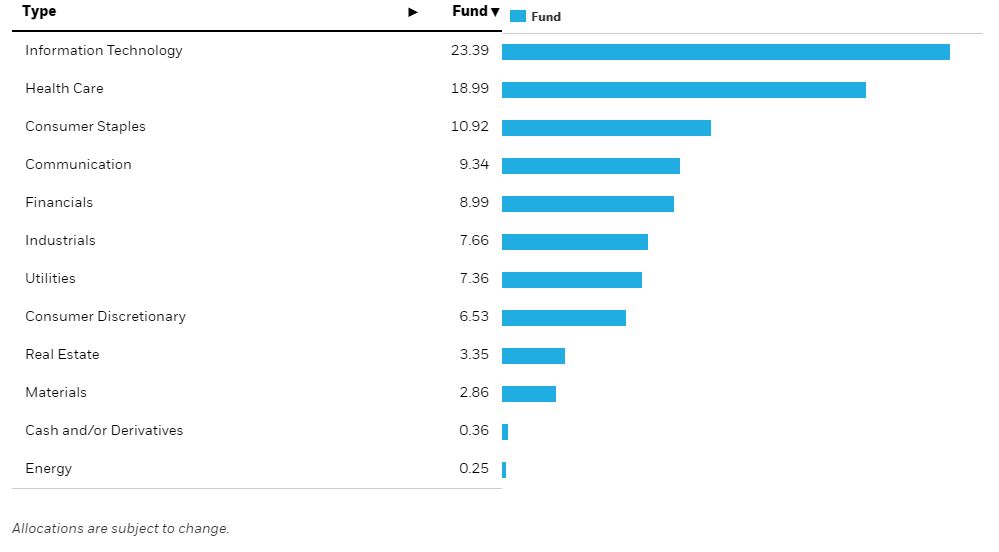
This factor, Wigglesworth points out, is the worst-performing factor over the last year. I wanted to see what was driving the underperformance, so I went and looked under the hood.
“Oh,” I thought. This looks a lot like consumer staples. Let me compare the two and see if this explains the underperformance.
Eureka!!
But actually, if you scroll back to the previous chart that shows the biggest holdings, not one of them is in consumer staples. In fact, only 11% of the fund is.
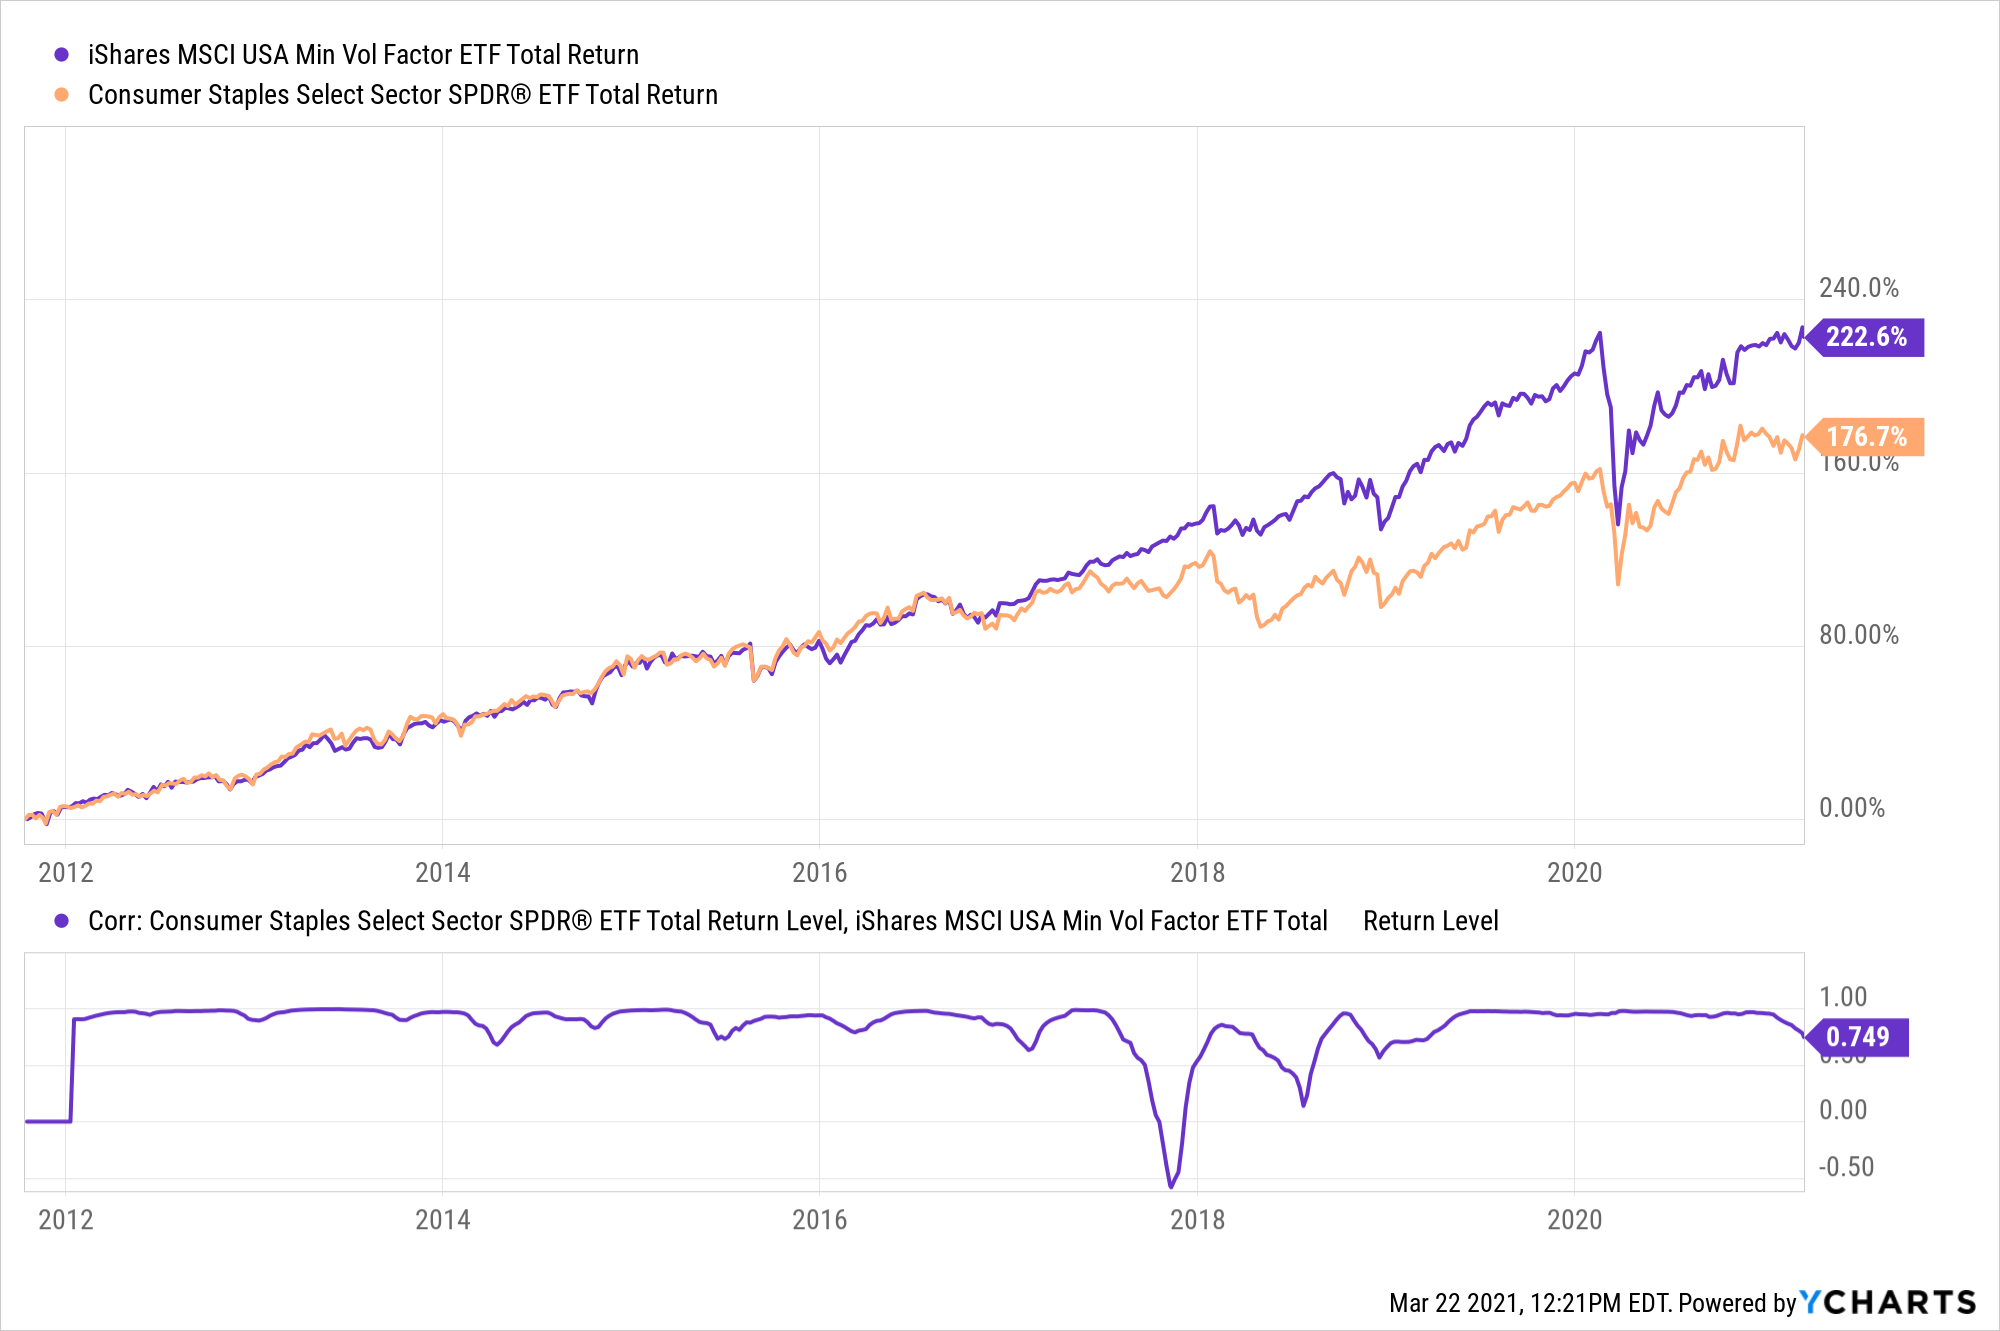
Even though 90% of the fund are in stocks other than consumer staples, there is no denying that this acts very much like a consumer staples fund. At least it has over the past 3 years. What happens if we zoom out a little more?
Double rainbow all the way!
From 2016 through 2017, this was a consumer staples fund with a different name. And then something funky happened towards the end of 2017 that threw a wrench into the gears. Absent whatever that event was, the two lines on this chart would be virtually identical. If anybody remembers what happened to drive the wedge in-between these two charts, I’d love to know.
So how is this possible? I mean, clearly, this is not a consumer staples fund. I guess a basket of the least volatile companies just end up behaving the same way as staples, even though they’re clearly not the same holdings? I wish I had a better explanation and would be all ears if somebody has one.
The point I’m trying to make is that it’s important to know your exposure. Whether it’s factors or anything else, don’t take anything at face value.
Michael Batnick is a managing partner at Ritholtz Wealth Management. He is the co-host of Animal Spirits, What Are Your Thoughts, and The Compound and Friends. For disclosure information please see here.
Get a Full Investor Curriculum: Join The Book List
Every month you'll receive 3-4 book suggestions--chosen by hand from more than 1,000 books. You'll also receive an extensive curriculum (books, articles, papers, videos) in PDF form right away.