Are younger people worse off today than prior generations were at similar ages?
According to this widely circulated chart, which shows that Baby Boomers held a much larger portion of U.S. household wealth in their 30s and 40s than Gen Xers do today at the same age, the answer is an unequivocal yes.
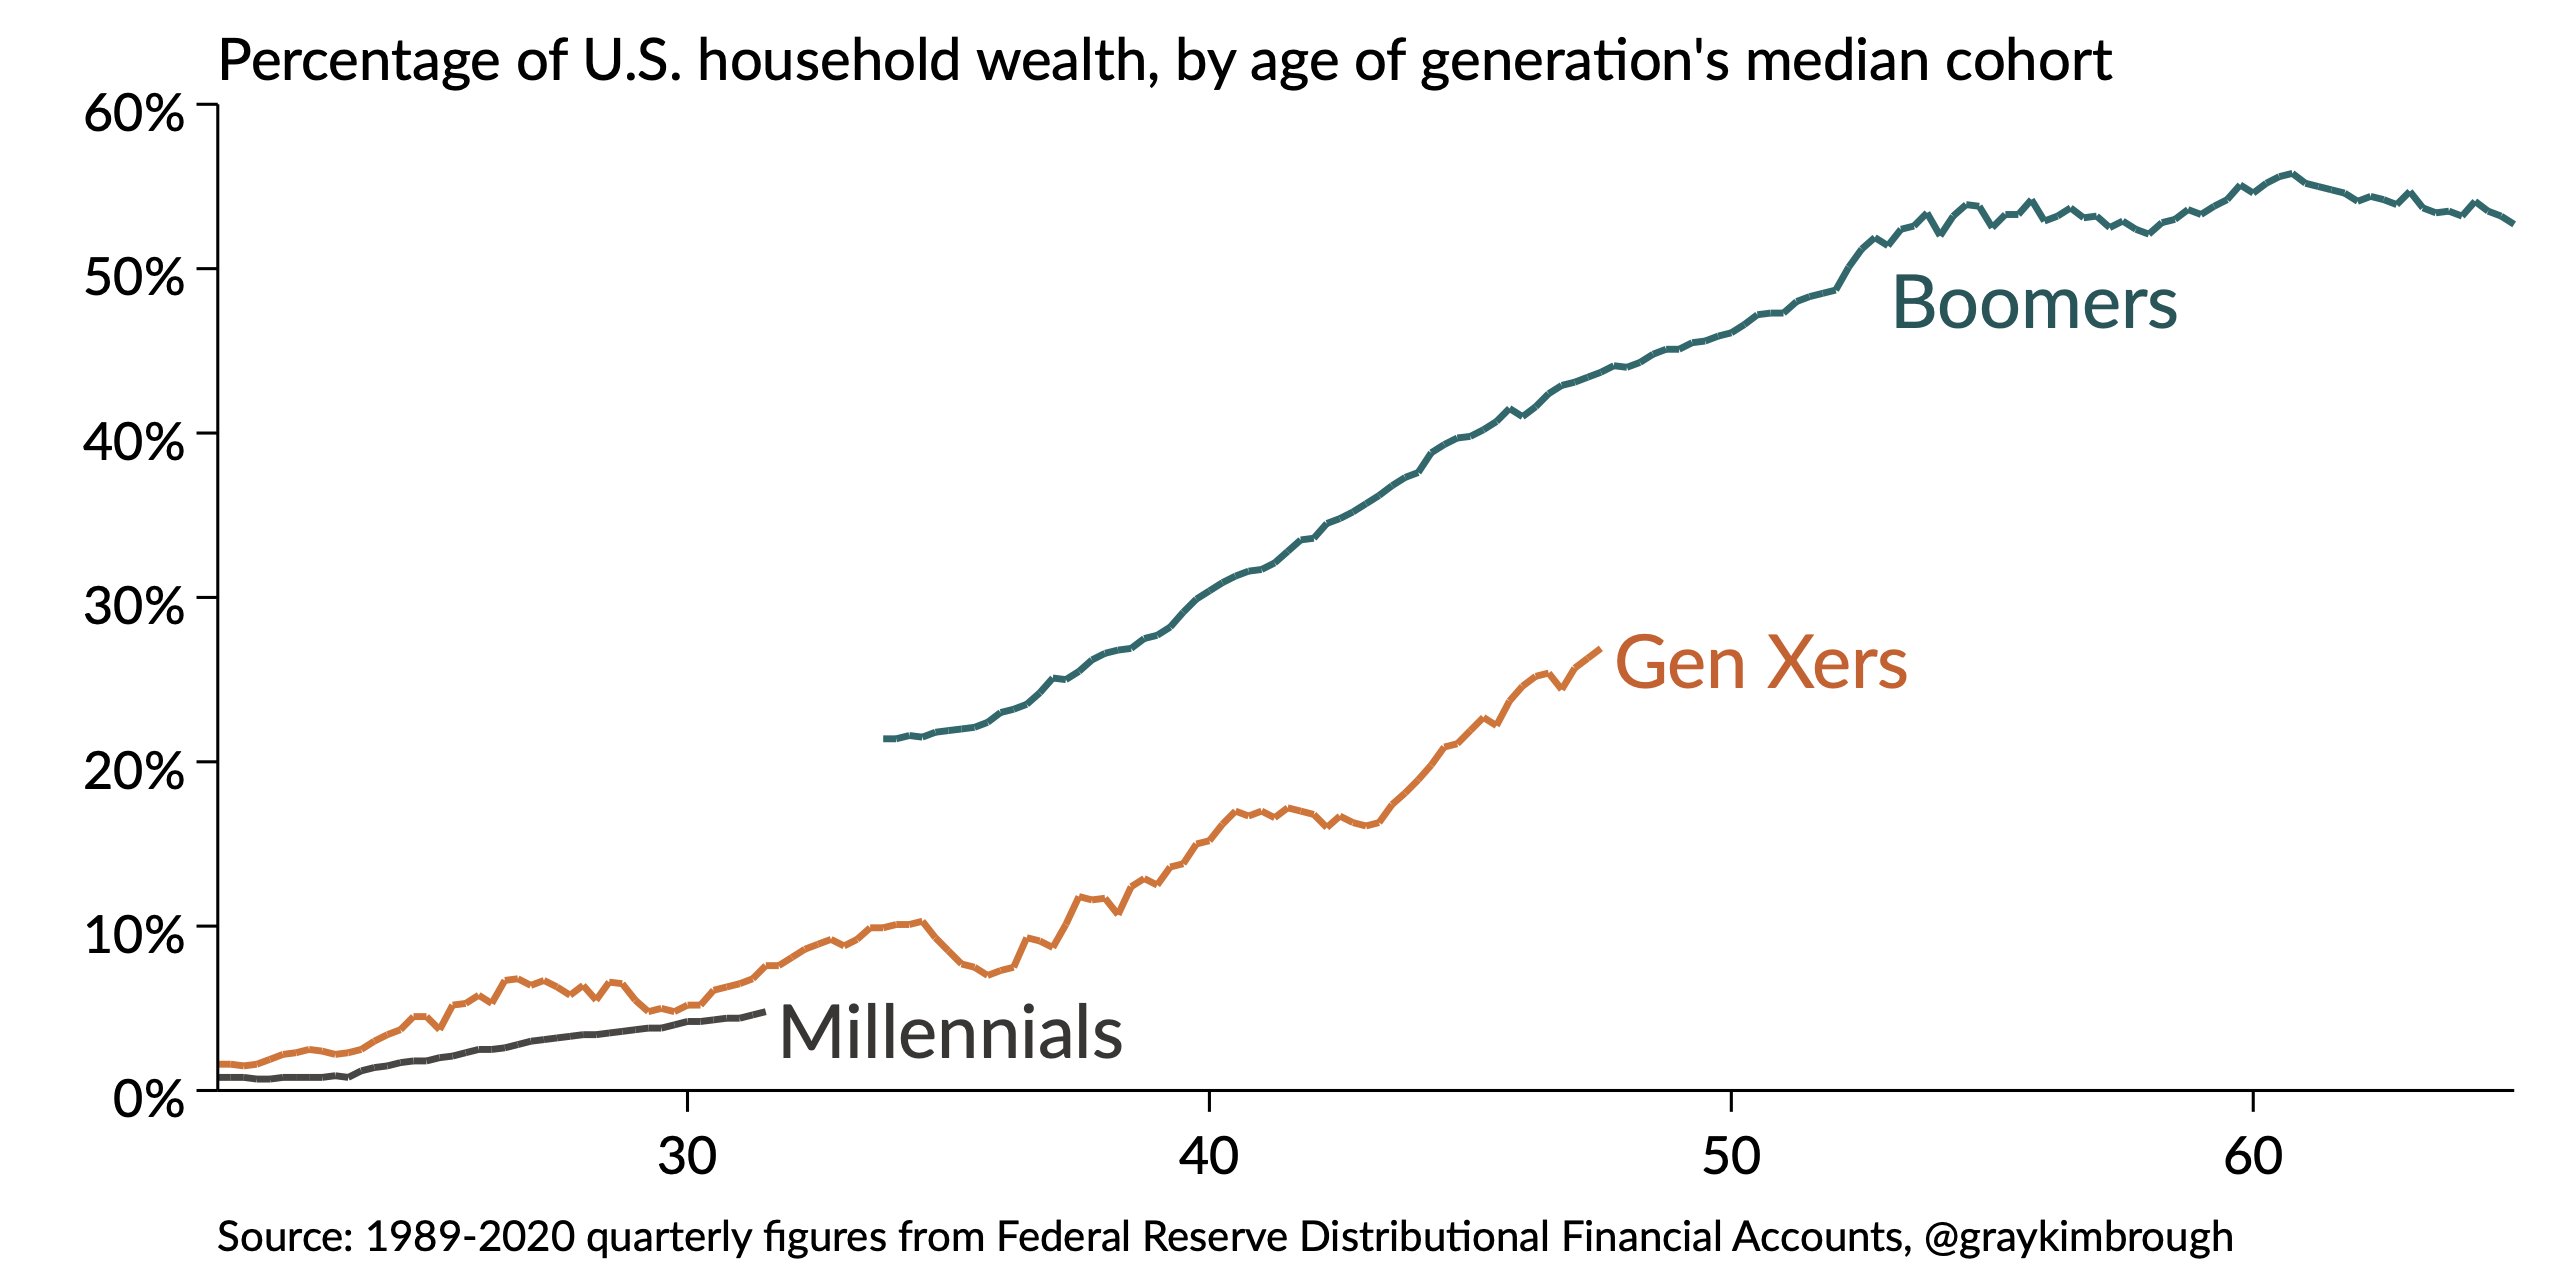
When you were born has an enormous impact on the type of returns you’ll earn in the stock market. It also has an enormous impact on the type of wealth you’ll build over the course of your life, especially in the early years.
The oldest Millennials entered the workforce while the economy was booming. But when the party ended, my Millennials (33-36) went looking for their first job while the unemployment rate was on its way to double digits. Then younger millennials arrived on the scene of a fairly sluggish recovery.
When it comes to being born at the right time, Millennials got the short end of the stick. At least compared to our parents, right? Well, actually, not so fast. An emailer would like to set us straight.
I enjoyed your latest podcast—you guys have a great dynamic that keeps the discussion going and focused on interesting questions. I do have an objection to raise to your point about boomers having been better off “because they didn’t have a generation above them sucking up assets like they are”. I remember when I entered the job market in the 70s (yes, I’m a boomer) we bemoaned our fate of being boomers because we were being spewed out of college and into the labor force in unprecedented numbers, driving competition for jobs up and wages down. Plus, upon graduation we had the worst economy since the depression from 1974 till the economic resurgence that started in 1983. And BTW, competition to get into college was very rough because of our numbers. Arguably the reasoning goes the other way: boomers were buying assets for 30 or so years starting in the late seventies as they got established in their careers, but they’ve been selling assets for the last decade or so, presumably to millennials. The past 10 years were a great market for stock buyers, lousy for newly retired boomers.
These are excellent points. Things were rough for the graduating class of 2008. They were also rough for the retiring class of 2008. Just because a lot of millennials had it hard doesn’t mean our parents had it easy.
We might look back on their market experience over the last 40 years and conclude their journey was a breeze. Nothing could be farther from the truth. They had the crash in 1987, the bursting of the dot-com bubble, and the GFC. At the lows in 2009, the S&P 500 was back to where it was in 1996! I would imagine that at that time, Boomers probably felt like they got completely screwed. Two crashes in 10 years and an entire career worth of savings wiped out. Now towards the end of their careers, how would they ever recover?
We now know they did, but they must have felt like their generation was cursed at the time. Entering the market in the crash of the 70s and leaving during the crash of the 2000s. Our parents earned stock market returns the hard way.
And yet, even with the stock market wind at their back, and bond market for that matter, it’s not like Boomers are exactly killing it.
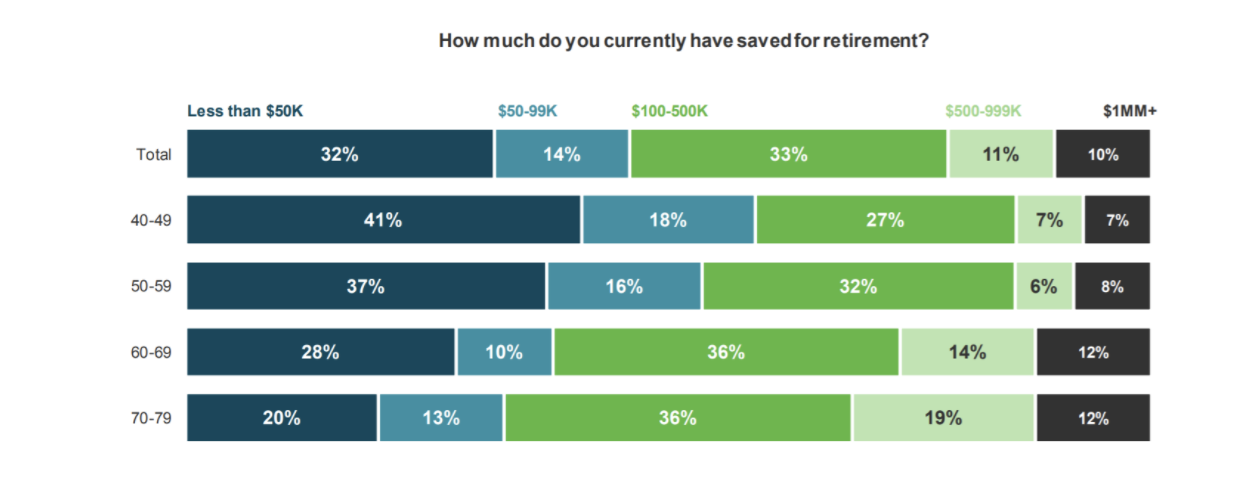
According to a 2019 survey from TD Ameritrade, 38% of people ages 60-69 have less than 100k save for retirement.
One of the biggest factors in determining net worth is real estate. For many people, a home represents the bulk of their assets. Given that our parents bought houses in their mid-20s and my generation is doing it in their mid-30s, that can greatly impact the first chart that I showed.
Our parents bought houses in the 70s for 100k that are worth 400k today. “We’ll never get that chance.” Yeah, we might not get 3.5% annualized home price appreciation, but that doesn’t mean we got completely screwed either. Please take a look at where mortgage rates were today versus where they were then.
Ben recently showed that “After adjusting for inflation and interest rates, monthly mortgage payments are now 30% lower than they were in 1989.” This chart doesn’t adjust for the size of the house. In 1973, the median house had 1,525 square feet of space. Today it’s closer to 2,500 square feet.

When you talk about Millennials, you’re grouping people at very different points in their lives. A 25-year-old is just figuring out what their career might look like. A 39-year-old might have kids, a mortgage, and is approaching their peak earning years. The College Investor has a great post that gets more granular on how different Millennials are doing. The average 25-year old has a net worth of -$24,000. Yes, negative $24,000. But the average 39-year old has an average net worth of ~$70k.

The St. Louis Fed puts out a great data series showing the deviation from real median wealth expectations by age group. When they ran these numbers in 2013, things were looking grim for people born in the 1980s. They were 55% below where they should have been. The survey from 2016 was 40% below, still bad but not as terrible. The results from 2019 show significant improvement. Significant improvement. Now people born in the 80s are just 11% below expectations. People born in the 70s are ahead of expectations!

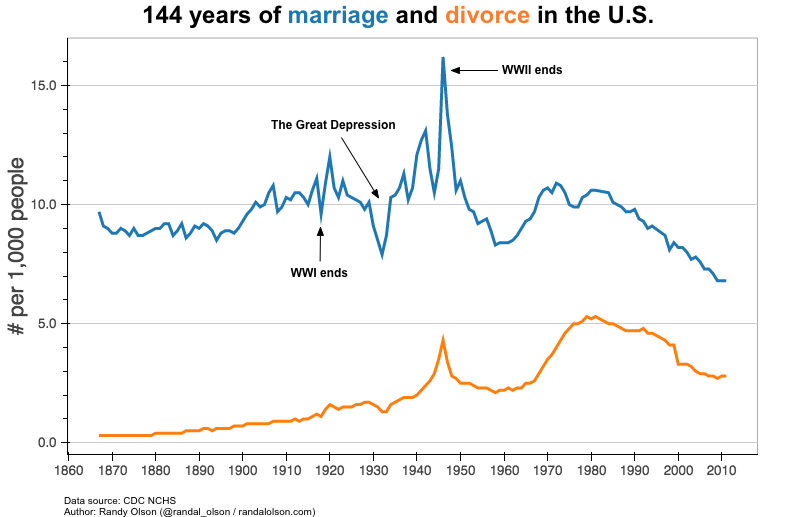
I don’t buy the narrative that our parents had it easy, and we have it hard. Perhaps a non-sequitur, but I would like to submit this chart for evidence. The divorce rate was super high in the 70s, 80s, and early 90s. This type of thing doesn’t happen when everything is awesome.
We know how it played out for older generations. Our story is still unfolding. I’m optimistic that the future is bright for my generation and not nearly as bleak as some of the data makes it seem.
Ben and I spoke about this and much more on this week’s Animal Spirits

