Market predictions are silly. We all learned this a long time ago. But that doesn’t mean they’re completely worthless. Even though forecasts are almost always wrong, they can be entertaining and educational. That’s all I’m trying to do with this post. Entertain and educate. Nothing in this list is investment advice. I’m not doing anything with my portfolio based on these predictions, and neither should you.
Alright, enough throat clearing. Let’s have some fun.
Large value will outperform large growth by 20%. One of the stories that went under the radar last year was the return of small value. While small growth returned 2.5% in 2021, small value gained 28%. This same dynamic did not take place in large stocks.
As the economy reopened over the first three months of last year, large value returned 11% while large growth fell 1%. It looked like the tide was changing, but the endzone dance was premature. Growth came roaring back, returning 29% through the rest of the year, while large value gained just 12% over the same time. Over the entire year, large growth gained 27.5% compared to a 25% advance for large value.
Small value/small growth looks good, while large value/large growth remains depressed.
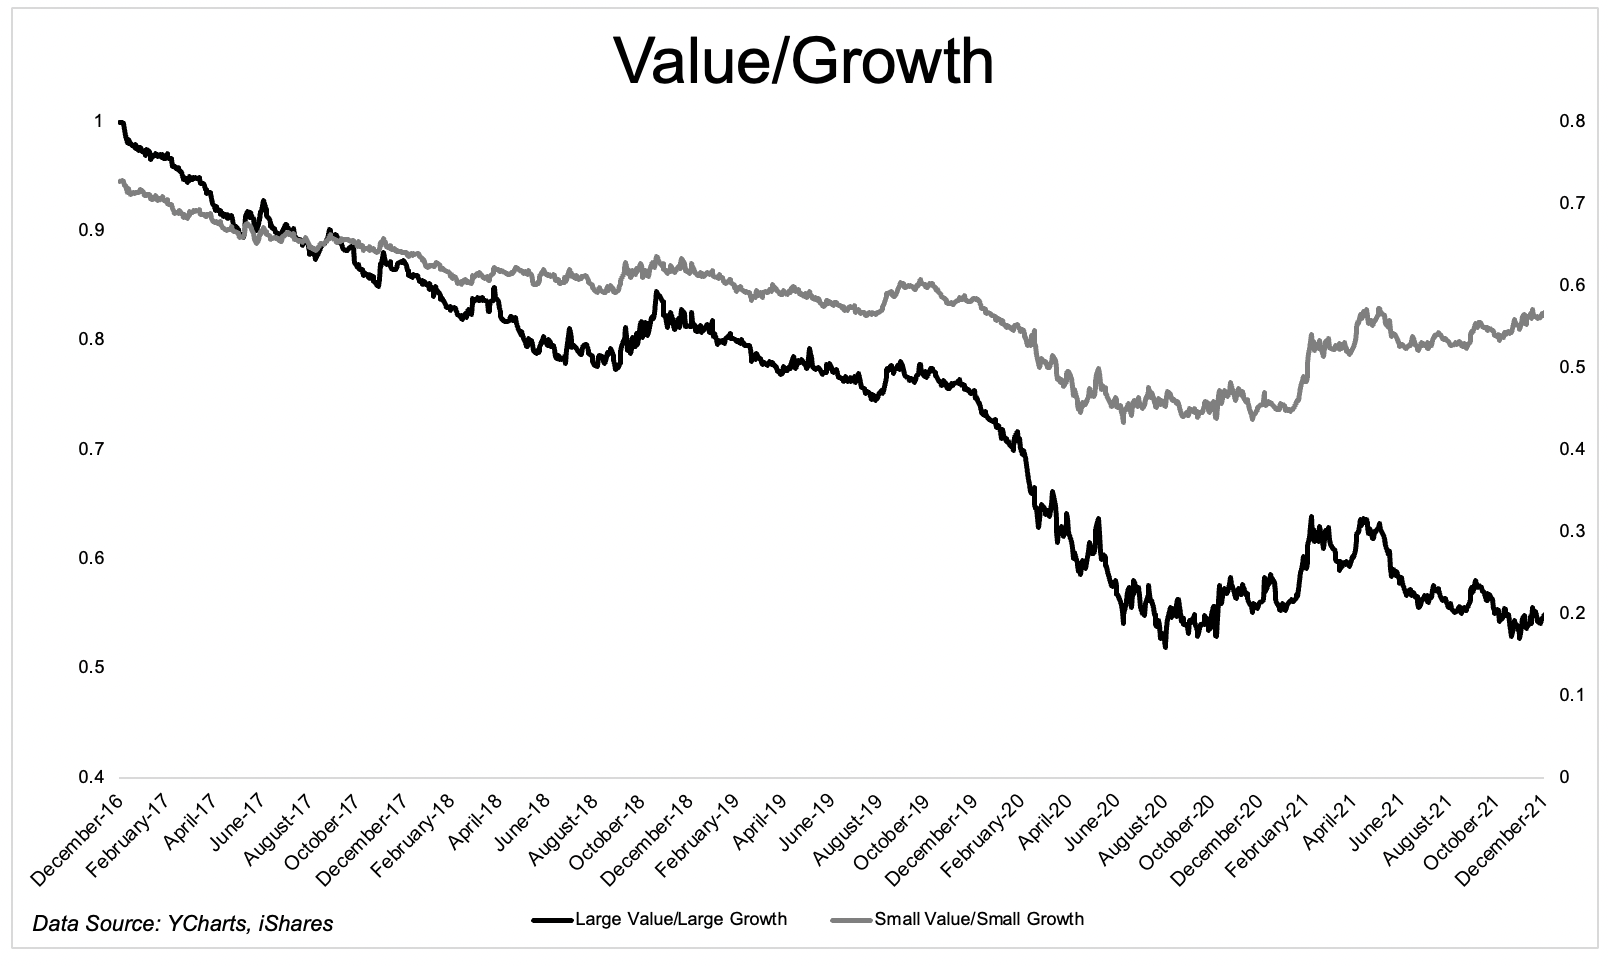
Large growth has outperformed large value for each of the last five years by an average of 14%. That reverses hard in 2022. For this to happen, large tech has to take a breather. If I get that wrong, I get this call wrong.
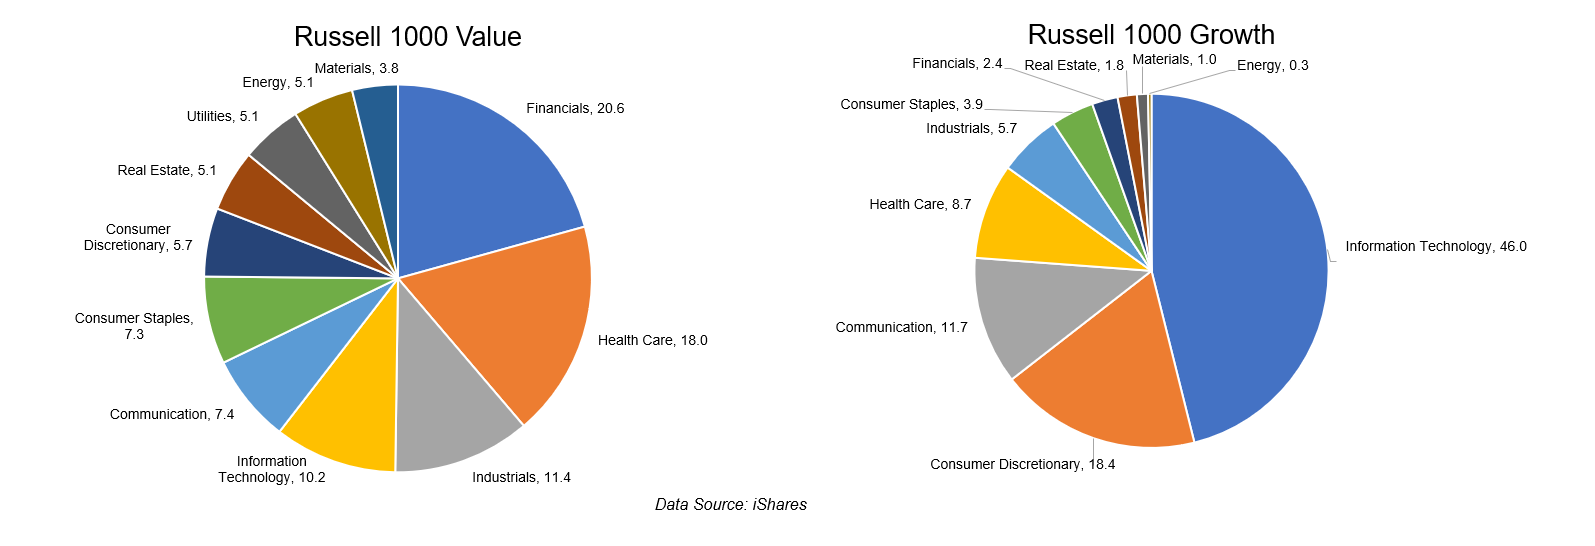
Not only does the composition of value indices look different than growth, but so does the concentration. The top 10 growth stocks represent ~49% of the index compared with just 18% for value. 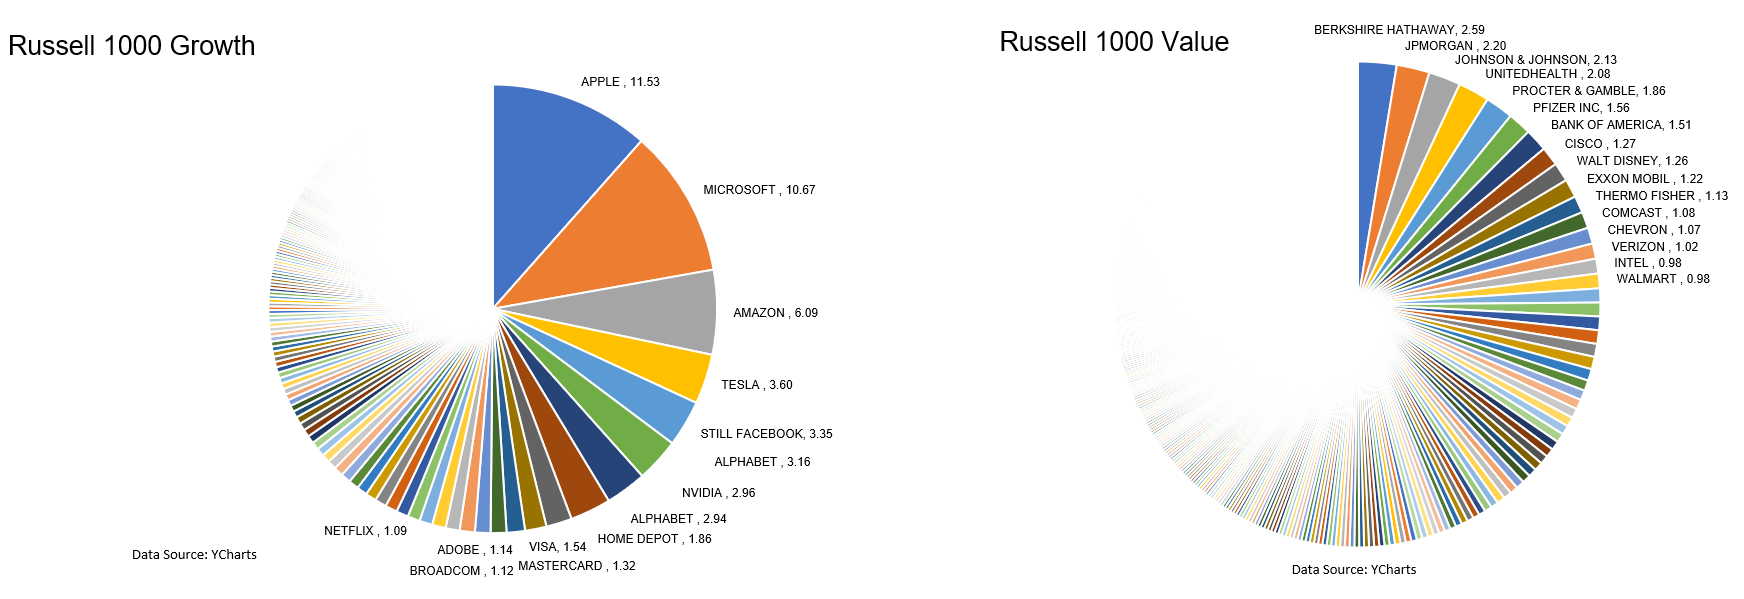
As the economy reopens and the fed normalizes interest rates, I would expect the most economically sensitive names to outperform.
Active managers will beat the benchmark. For this to happen, the previous prediction must come true. Stock pickers will not exceed the benchmark so long as big tech beats the benchmark.
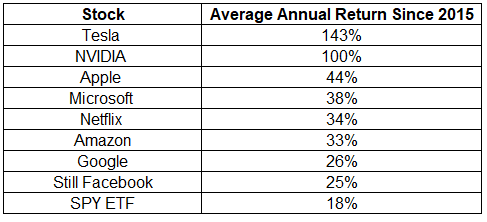
Apple, Amazon, Facebook, Google, Microsoft, Netflix, Nvidia, and Tesla added nearly $3 trillion in market cap in 2021. Anything approaching a repeat performance would shock me.
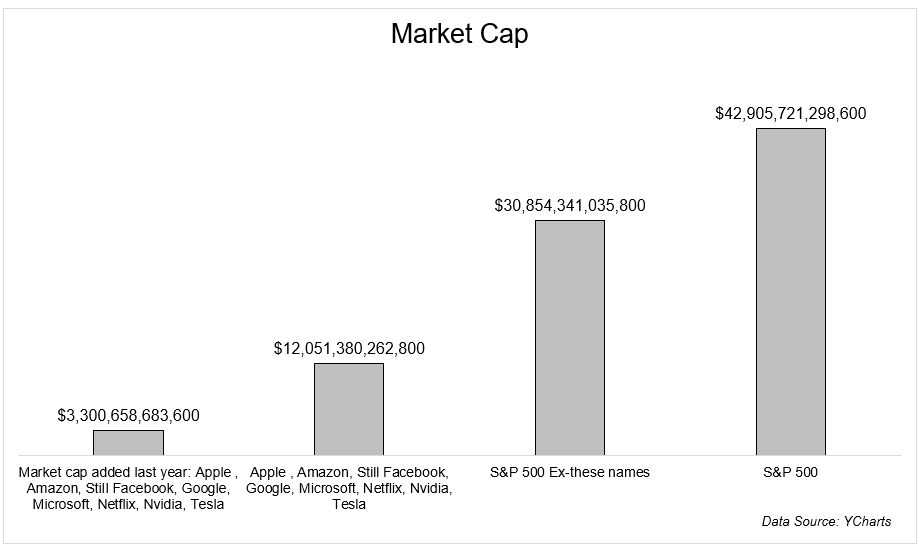
It’s hard to beat the index when the biggest names do this.
It’s been a while since large-cap managers have had much success as a whole.
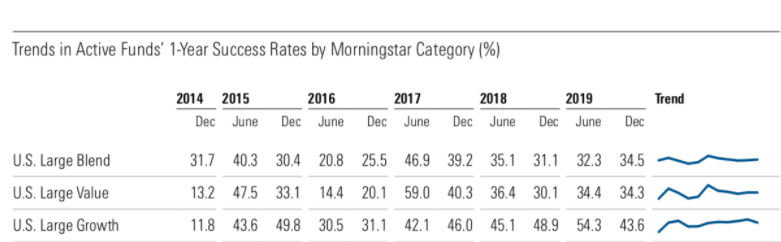
2021 was a disaster for large-cap managers. Only 21% of large-blend managers outperformed the S&P 500. 2022 will indeed be the year of the stock picker.
China tech dip buyers will be rewarded. KWEB will gain > 30% in 2021. I don’t know that I’ve ever seen a chart like this before: Chinese internet companies are down 62% from their February high, and yet money has still come into the fund, KWEB.
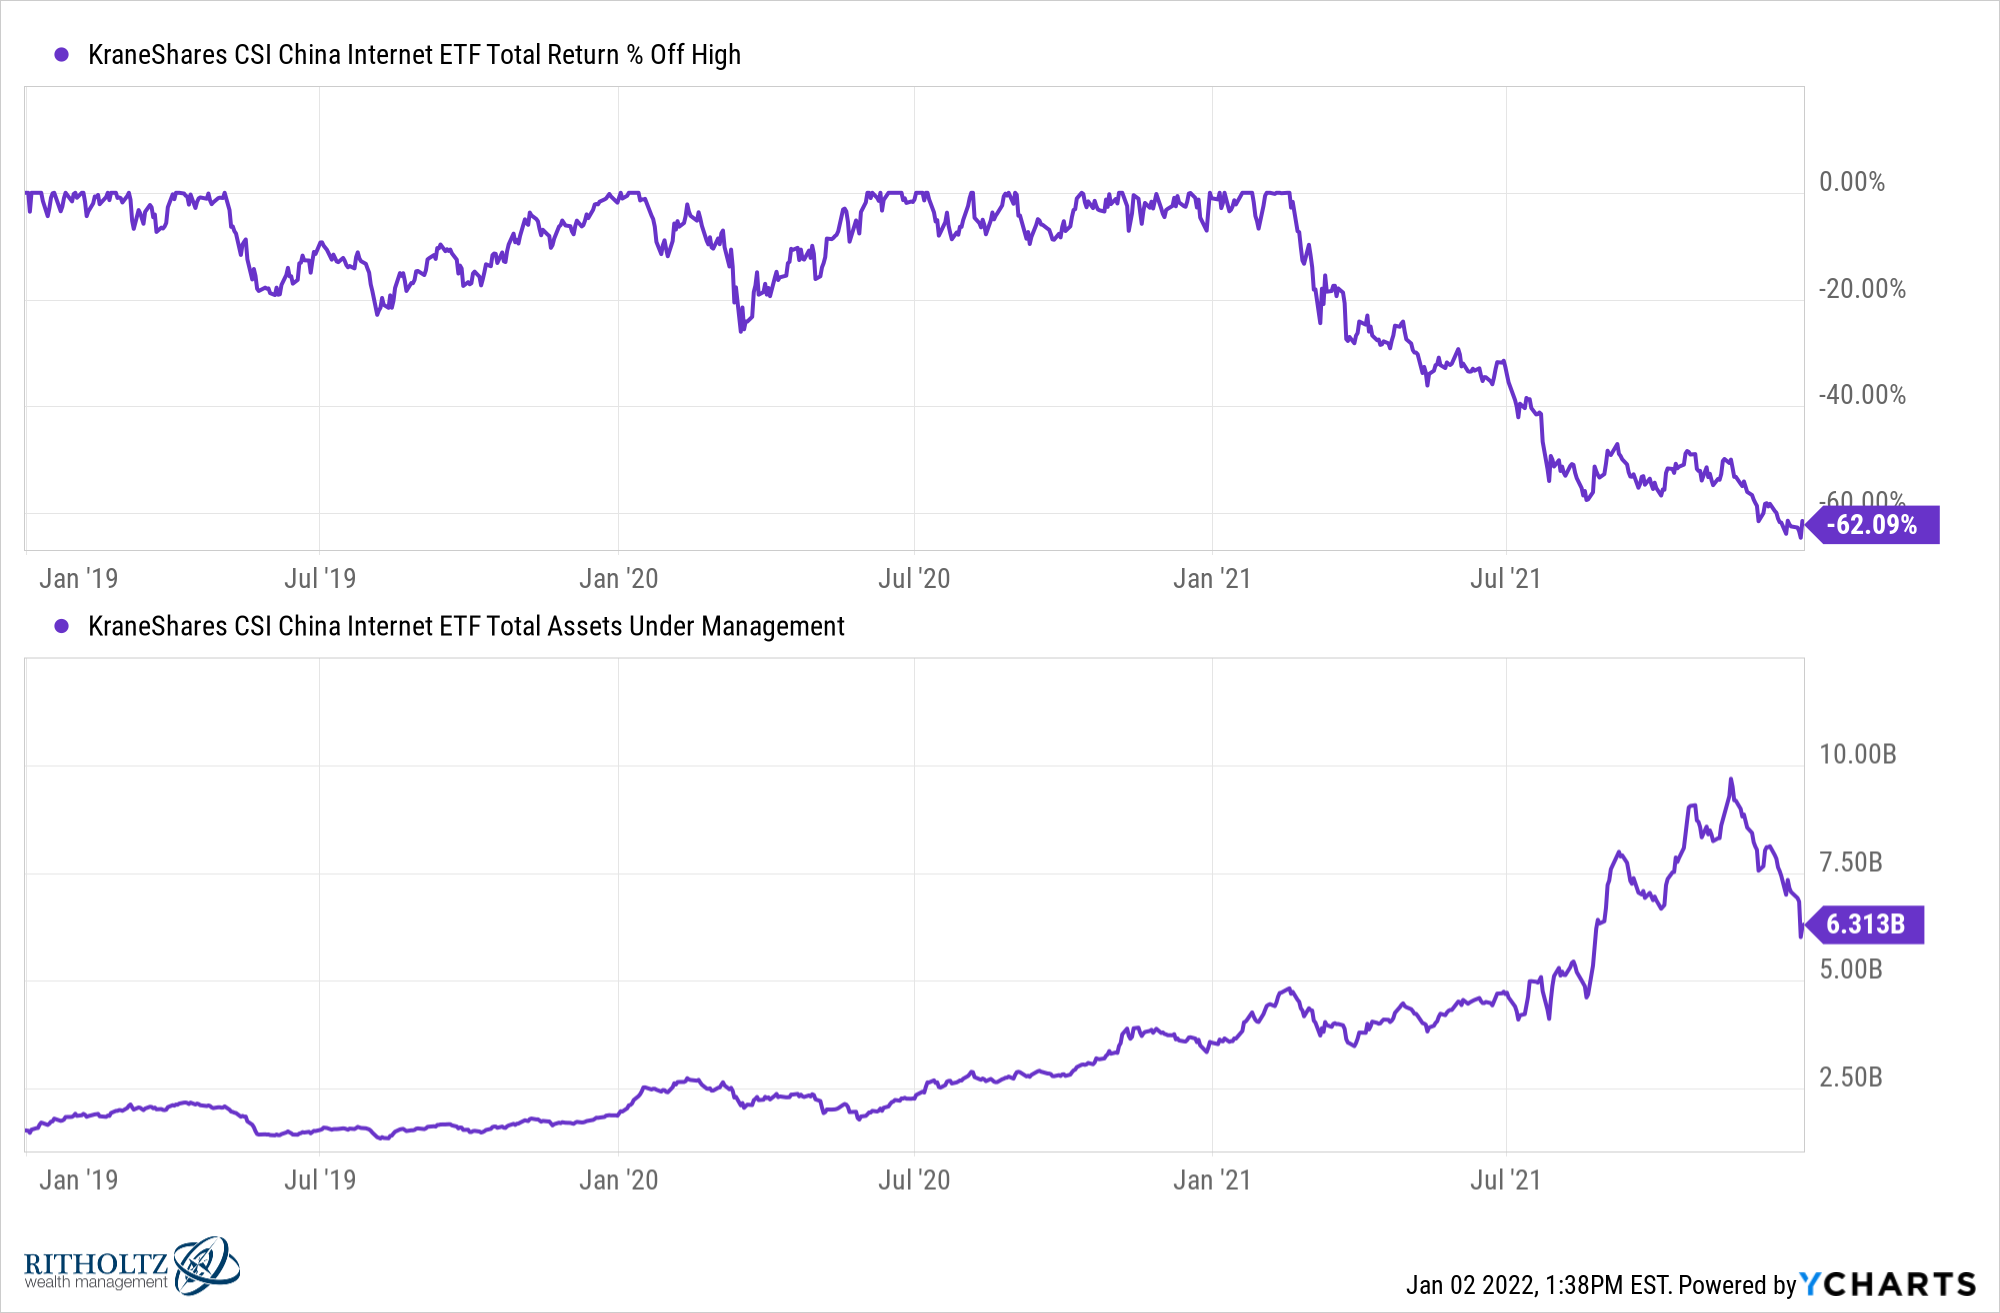
KWEB added $7 billion in 2021, making it a top-25 asset-gathering ETF in 2021. (H/T Balchunas)

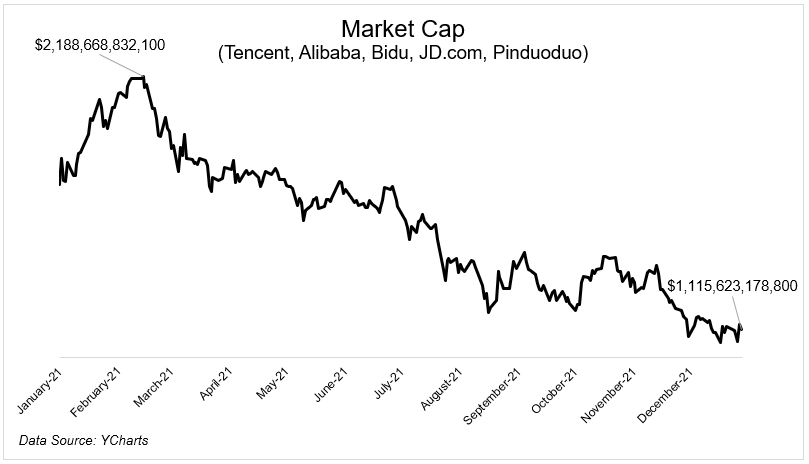
Five of the largest Chinese tech stocks fell $1 trillion from their peak in early February. Internet censorship in China nuked their stocks in 2021.
Dip buyers have been punished so far but will be rewarded in 2022.
Bitcoin will see $30,000 and $100,000. Bitcoin isn’t quite as volatile at $1 trillion as it was at $10 billion, but it still swings around like crazy. $30,000 would be a 37% decline from current levels and a peak-to-trough decline of 57%, certainly in line with historical drawdowns.

A few more crypto related predictions
- ETH will not flip Bitcoin
- The SEC will not approve a spot Bitcoin ETF
- Tesla is the only S&P 500 company with Bitcoin on its balance sheet. That will change in 2022.
META will add $1 billion in assets in 2022. Talk about being in the right place at the right time. If you look carefully at the chart below, you can see where Facebook changed its name to Meta.

There are 40 thematic ETFs with $1 billion. META will go from an outsider to the top 20 in 2022.
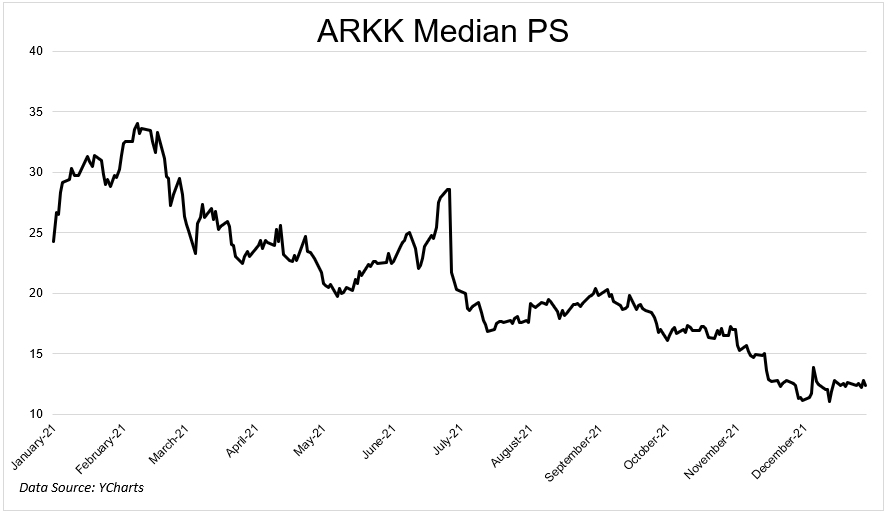
ARKK will outperform the Nasdaq-100 by 20%. It’s hard to believe, but ARKK underperformed QQQ by 50% in 2021.

The median stock in the fund is down 52% from its 52-week high, while the fund itself is in a 39% drawdown. The S&P 500 and Nasdaq 100 for comparison purposes are at all-time highs.
The median PS ratio of the stocks in the fund peaked at ~35 in February and is 12 today. I don’t know if these names are deep value, but they’re certainly cheaper than they were a year ago.
Tesla doesn’t converge with fundamentals. The most controversial company stock on the planet crushed it last year. It gained 50% in 2021, or $383 billion. That’s roughly the size of PG, or Proctor, or Proctor & Gamble if you’re not into the whole brevity thing.
This wasn’t just the result of ever-expanding multiples. The business flat out delivered, literally. They did 936,172 vehicles in 2021, an 86% increase over 2020. The fact that they could do this during a global chip shortage is super impressive.
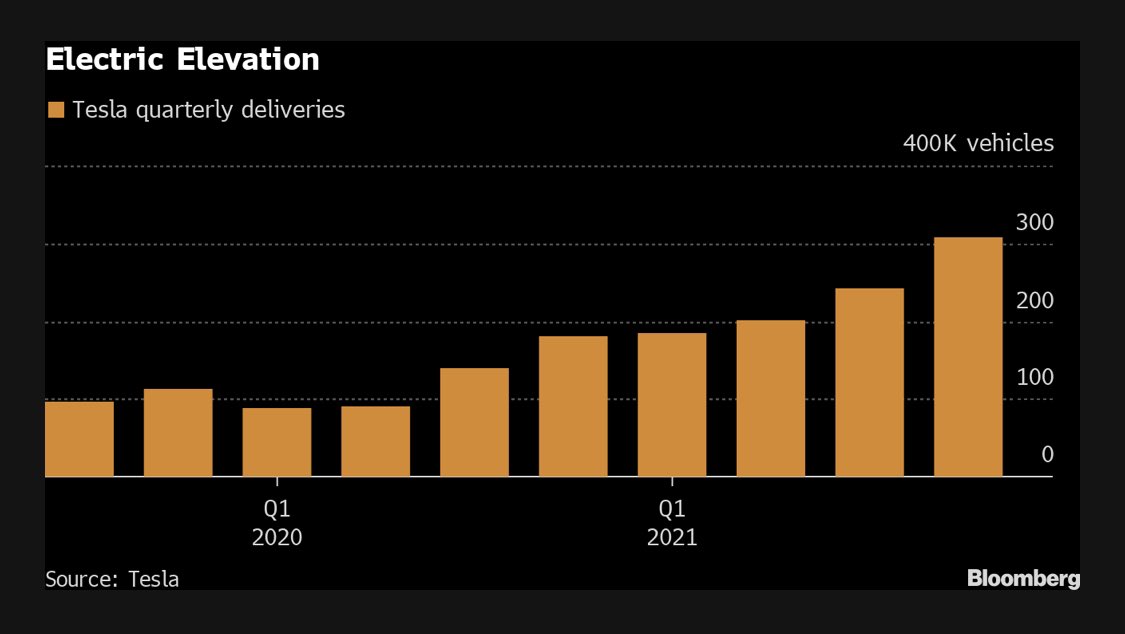
But however way you slice it, Tesla the stock looks stretched.

Traditional fundamental metrics haven’t deterred Tesla shareholders over the last few years* and I don’t see that reversing in 2022. The stock won’t repeat 2021, but it won’t crash either.
*Tesla is up 2,370% over the last five years. It has crashed 50% twice during that time.
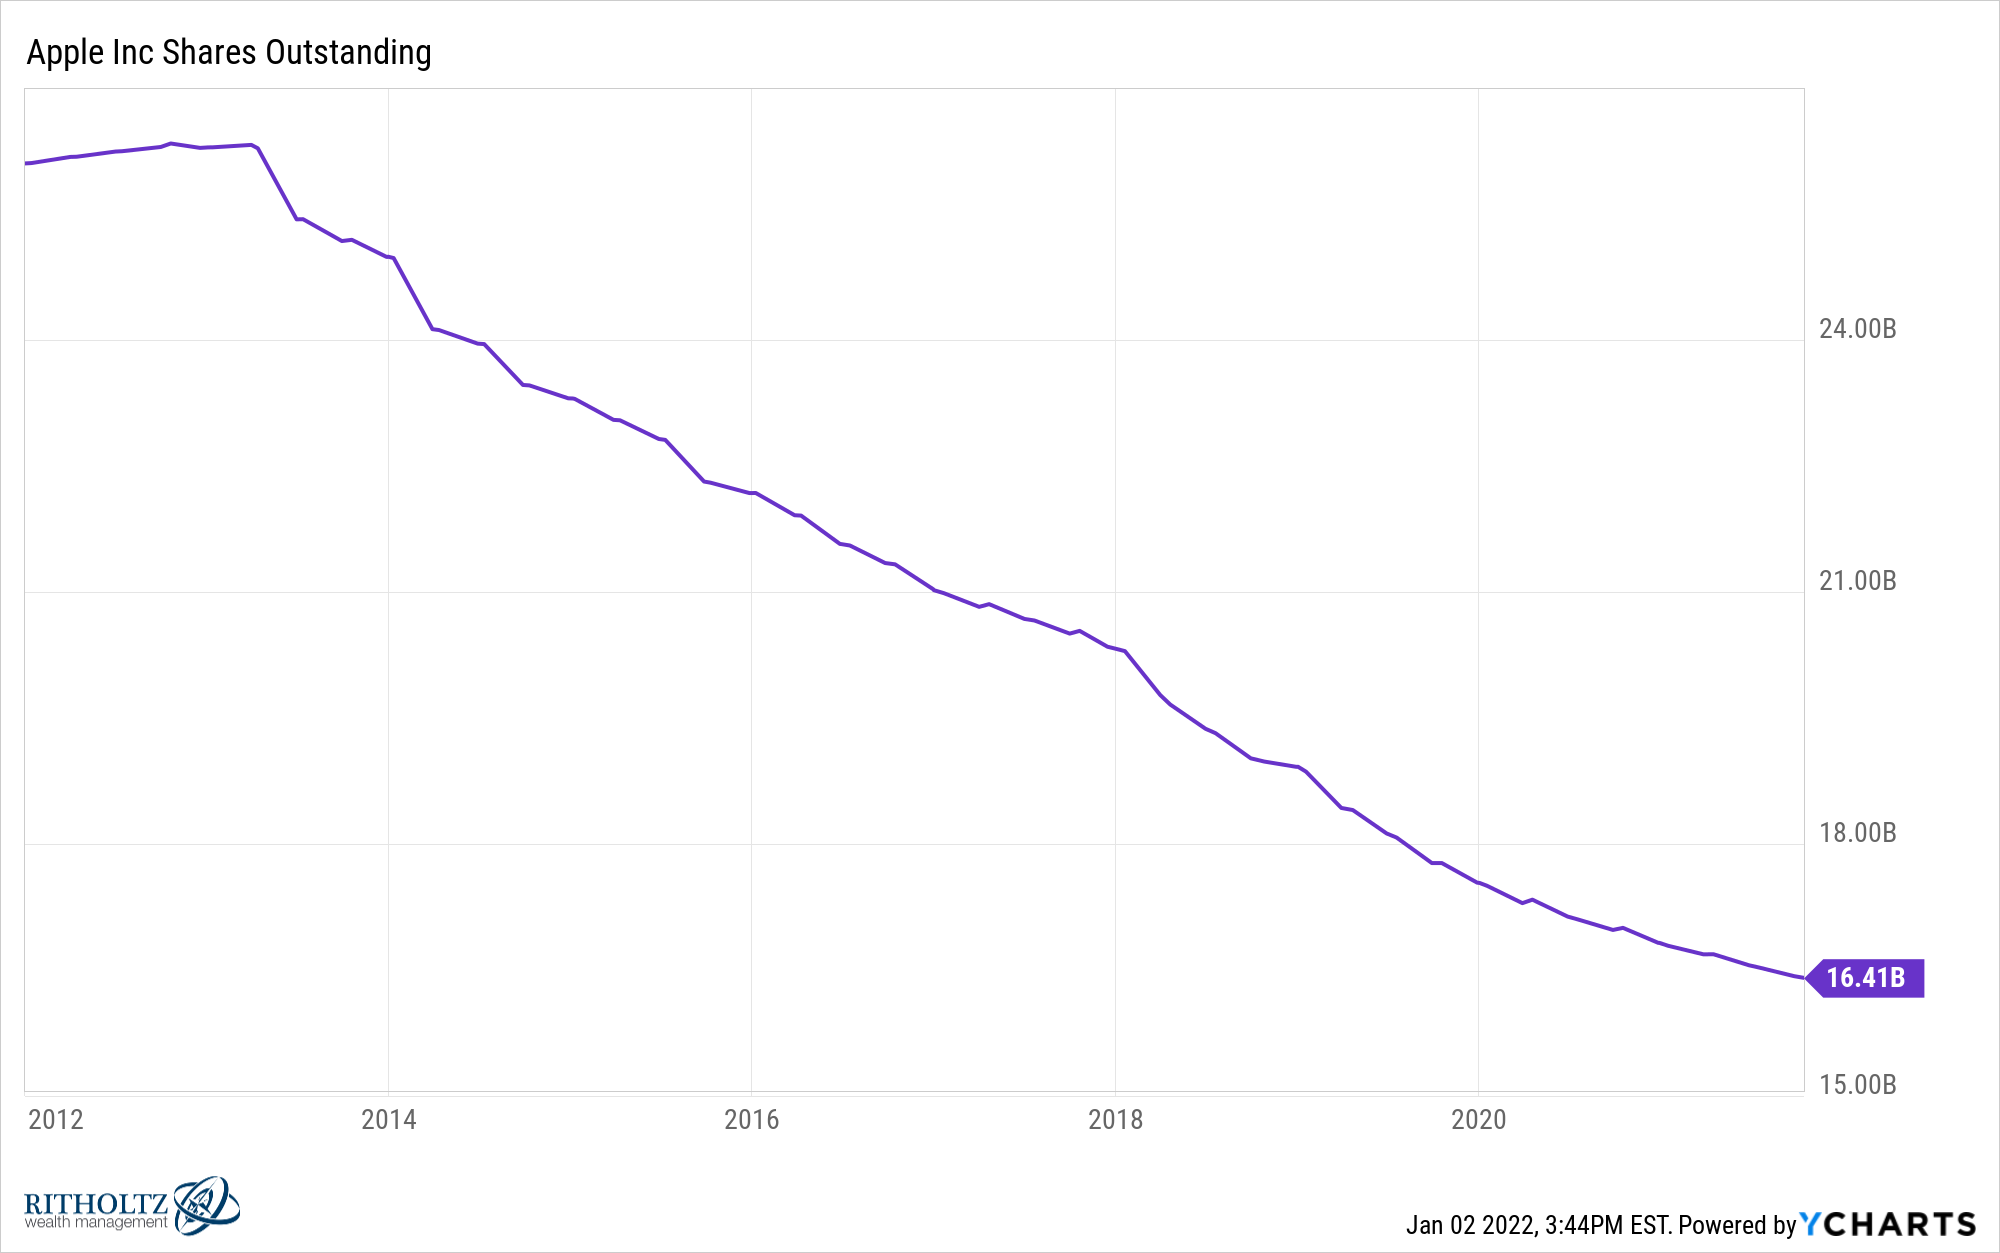
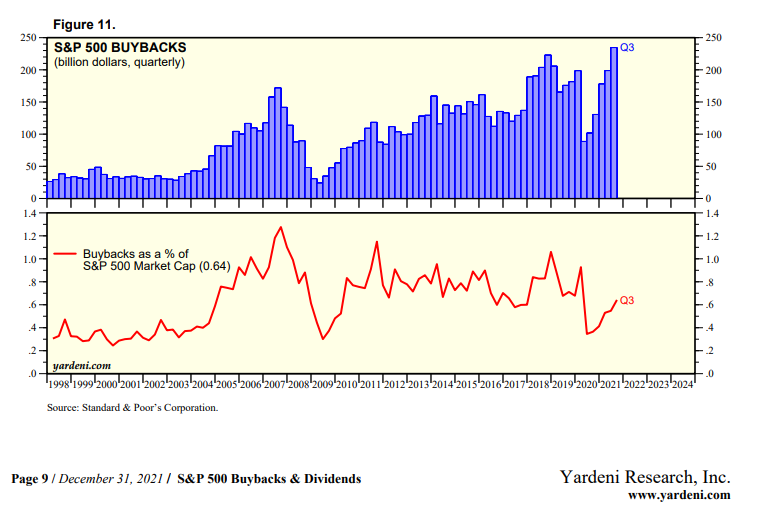
Buybacks will set a record. This feels less like a prediction and more like an inevitability. After crashing in 2020, buybacks came roaring back in 2021. There’s no reason to think this trend won’t continue into 2022.
The biggest buyer backer, Apple, has shrunk its float by 37% since it started this program in 2013. Over this time, Apple has spent $455 billion retiring shares.
Lest you think buybacks are manipulating stocks higher, the following chart shows that the buyback index actually has underperformed the plain-vanilla version over the last three years.
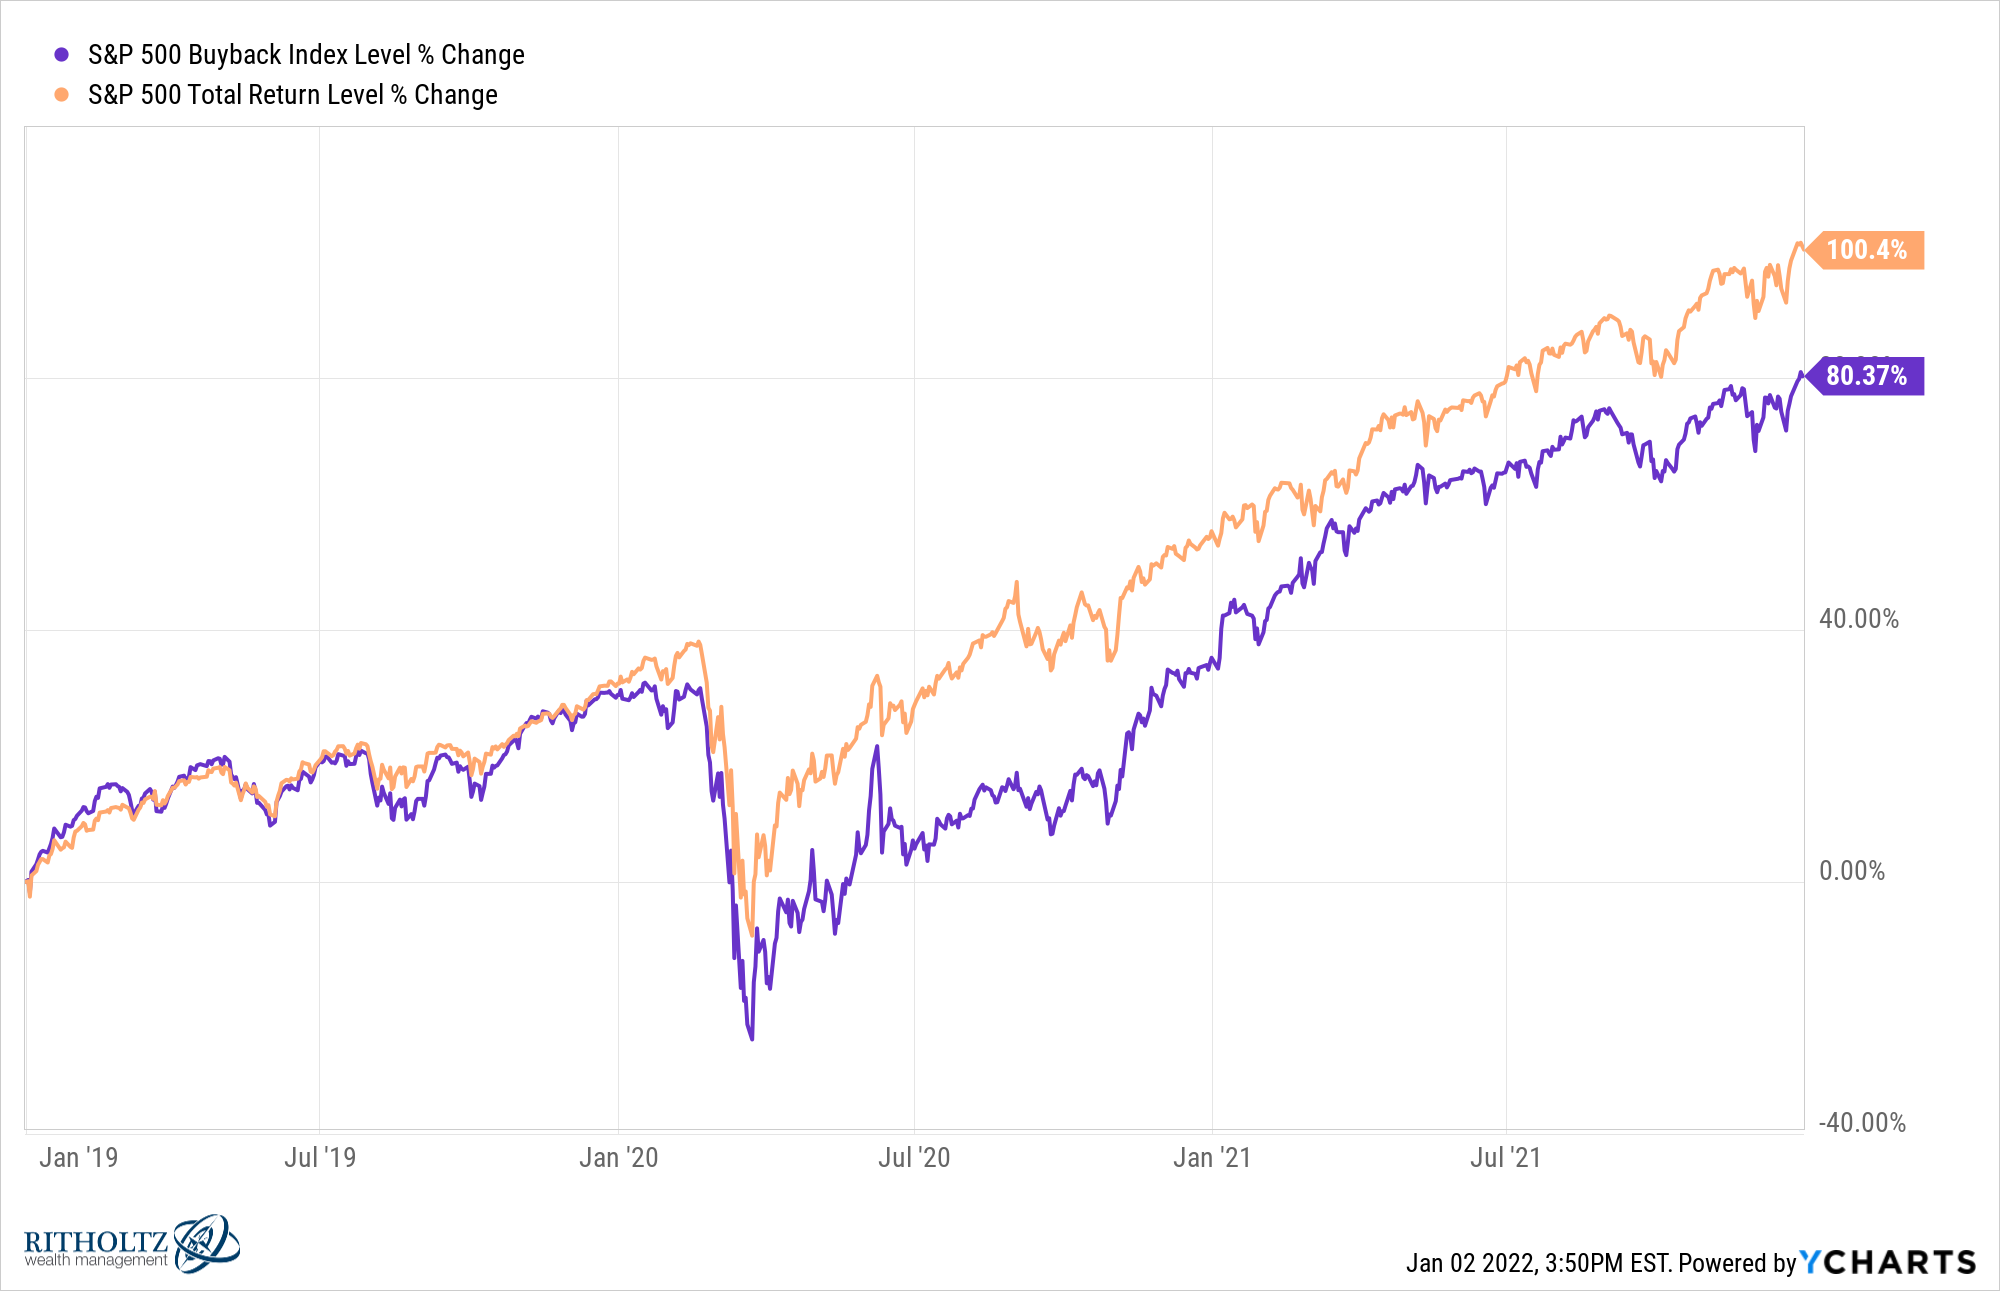
That last chart might not change your mind if you’re in the buybacks are manipulation camp. This next one should. Buybacks as a % of S&P 500 market cap were 0.64% in the most recent quarter.
The fed will lower rates. They have telegraphed three interest rates for 2022. They’ll do two, and then the market will fall apart. Instead of a 3rd hike, they’ll reverse course and lower rates to stop the market from falling further.
Out of all my predictions, this is the one that I really hope doesn’t come true. If we can’t normalize rates now, I’m not sure when we ever will.
The S&P 500 will have its worst year since 2008. This isn’t as bold as it sounds. The worst year for the index since 2008 was -6%. I predict this year it will fall more than 15%. The combination of high multiples, high inflation, supply chain issues, and the fed raising interest rates will prove to be too much for investors to handle.
Over the last three years, the S&P 500 has gained 31%, 18%, and 29%. If you can’t stand to see the equity portion of your portfolio give back a little, eventually, you’ll be in for a rude awakening. If we see a pullback, try to think of it as the source of future returns. If you think of declines as a fee instead of a fine, you’ll set yourself up for a lifetime of successful investing.
Thanks for reading. We’ll check back in 12 months 🙂

