Only one economic indicator has a perfect track record of predicting a recession. It’s when the yield curve inverts. That might sound jargony, but it’s pretty simple; It’s when shorter-term rates are above longer-term ones, and every time that’s happened since 1955, the economy went into recession between six and twenty-four months later.

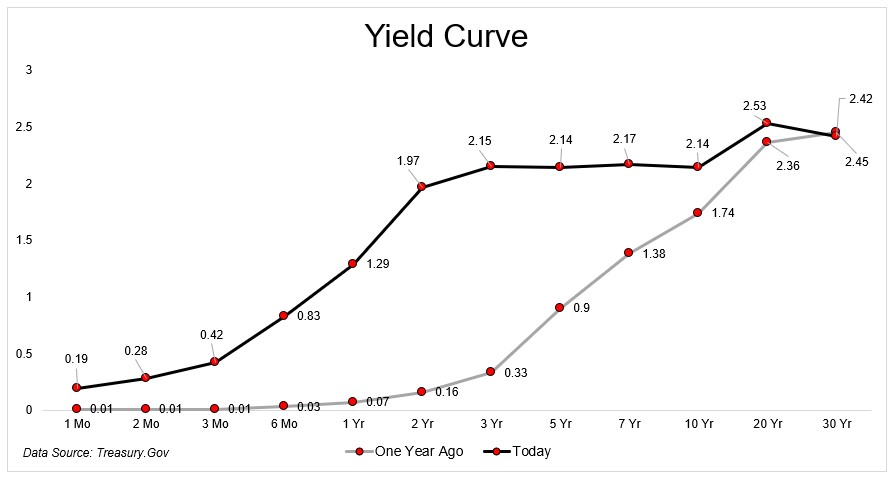
Typically, you would expect a positively sloping yield curve, where the rates are higher the longer you go out in time. That makes intuitive sense. If you’re going to lend money for ten years, you’d want a higher rate of return than if you were making a two-year loan to the same borrower. A steepening yield curve, generally speaking, means that investors have solid expectations for economic activity. A flattening yield means the opposite, which is where we find ourselves today. Shorter-term rates are rocketing higher as traders prepare for a number of rate hikes this year. Longer-term rates aren’t rising as fast, possibly signaling that investors expect that higher rates will slow down the economy.
Aside from just signaling, the shape of the yield curve does have real-world implications. Rising short-term rates make it more expensive for people to borrow money, whether for a mortgage or a small business loan or whatever. Compounding problems, at least theoretically*, is that when the curve flattens, banks, who borrow short and lend long, see their margins crimped and might be less willing to extend credit.
It’s always hard to pin down exactly what’s motivating buyers and sellers, especially in the bond market that’s so impacted by the federal reserve. I won’t pretend to be an expert here, so I’ll lean on BMO, who recently said “We’ll be the first to concede the shape of the curve (particularly 2s/10s) doesn’t retain the recessionary signaling power it was once thought to; although this won’t prevent it from weighing further on sentiment in financial markets.”
I guess I’ll take some comfort in the first part of that statement, considering how rapidly the yield curve has flattened recently. Some parts of the curve are already inverted; 10s are below 7s and 30s are below 20. Again, I won’t pretend to know all the dynamics driving price action here, but the usually boring bond market has taken center stage.
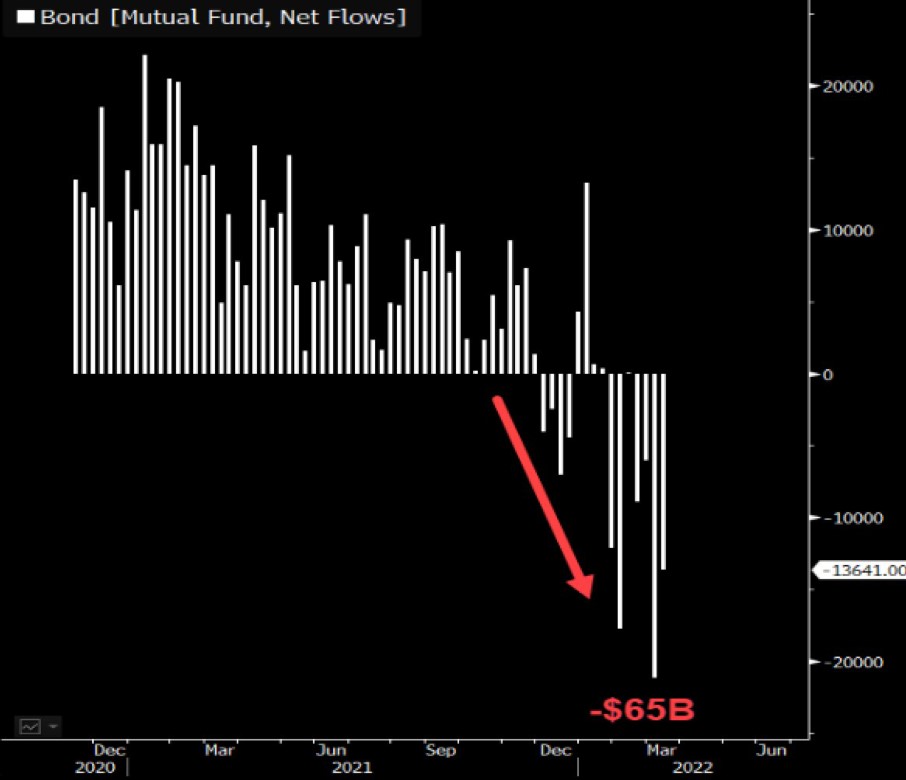
This chart from Eric Balchunas shows a sharp reversal of bond mutual fund flows, which have been a constant vacuum for most of the last decade. It’s still early, but the $65 billion in outflows would be the worst year for flows since they started tracking this data in 2007.
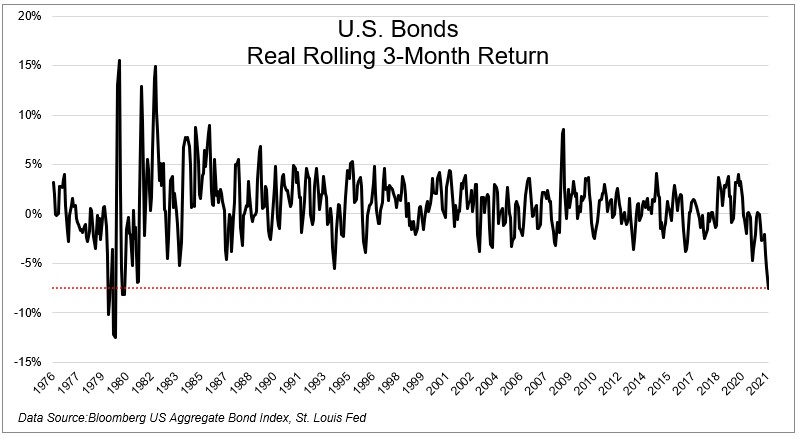
Rates go up, prices goes down, and people sell their bonds. Or is it, people sell, rates go up, and prices go down? Either way, returns are falling at a rate not seen in decades. Bonds are down 2% this month, so assuming that holds, we’ll have the first 5% decline over a three-month period since 1980. And that’s before inflation 😬

Assuming 1% inflation this month with a 2% decline in bonds, investors will be looking at a 7.5% negative real total return for the last three months, also the worst return since 1980.
To make matters worse, bonds have declined alongside stocks for an extended period of time. The S&P 500 and the Bloomberg US Aggregate bond index have both declined for consecutive months ten times since 1976. They’ve never both had negative returns for three straight months, which is where it looked like things were headed. That is, until last week, when the S&P 500 had its strongest four-day run since the start of the pandemic. Right now, the S&P 500 is up 1.8% for the month.
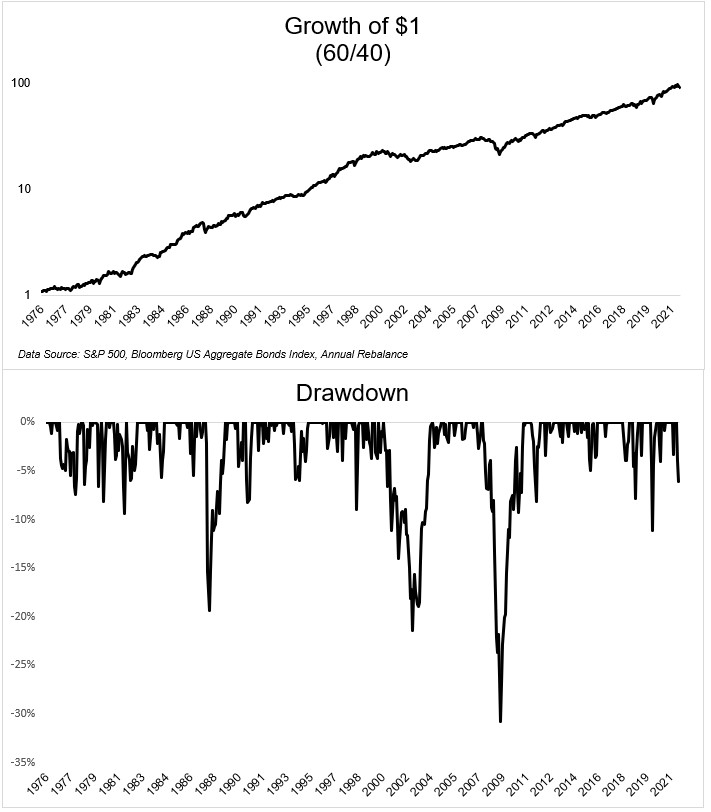
Okay, a few things. Investors have had it pretty darn good recently. Even after the decline, a 60/40 portfolio has compounded at 12.5% per year for the last three years.
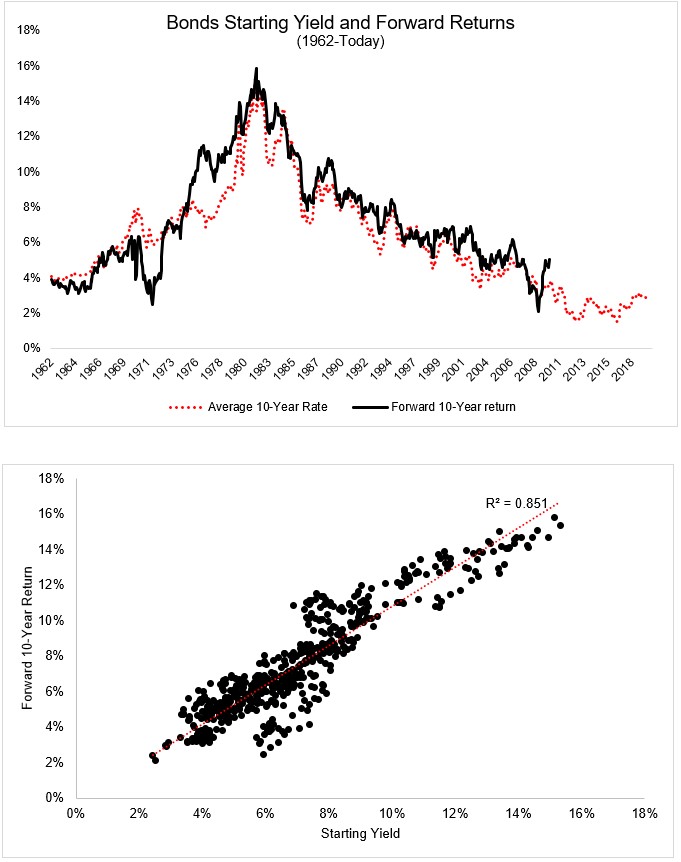
The thing to keep in mind is that if you own fixed income securities, then you should be praying for rates to rise. Yes, it will push the price of some of your current bonds down, but if you give it enough time, the decline will be more than offset by higher future income. Since bond returns are a simple function of their starting interest rate, then we should want the starting interest rate to be higher, not lower. I made this chart last year, which demonstrates the relationship between rates and returns.
Yes, bonds have gotten killed in the last three months, but this really needs to be put in context. A 5% negative total return over a three-month period isn’t fun, but that’s like a bad week for a stock index and a stormy afternoon for an individual stock. If you’ve hated bonds for the last couple of years because rates have been so low, then the recent uptick in rates should be welcomed with open arms.
We spoke about the bond market and much more on the most recent episode of The Compound and Friends
*I say theoretically not because I don’t believe it, only because I’ve never seen data confirming banks pulling back when the yield curve flattens.

