I keep coming back to this theme that things feel a lot worse than what’s revealed by looking at how far the S&P 500 is from its all-time high. One of the primary reasons, and there are several, is the number of stocks absolutely blowing up. The names coming undone were the darlings of the pandemic, and so we’re particularly sensitive to their unraveling. And the speed at which they’re doing it is breathtaking.
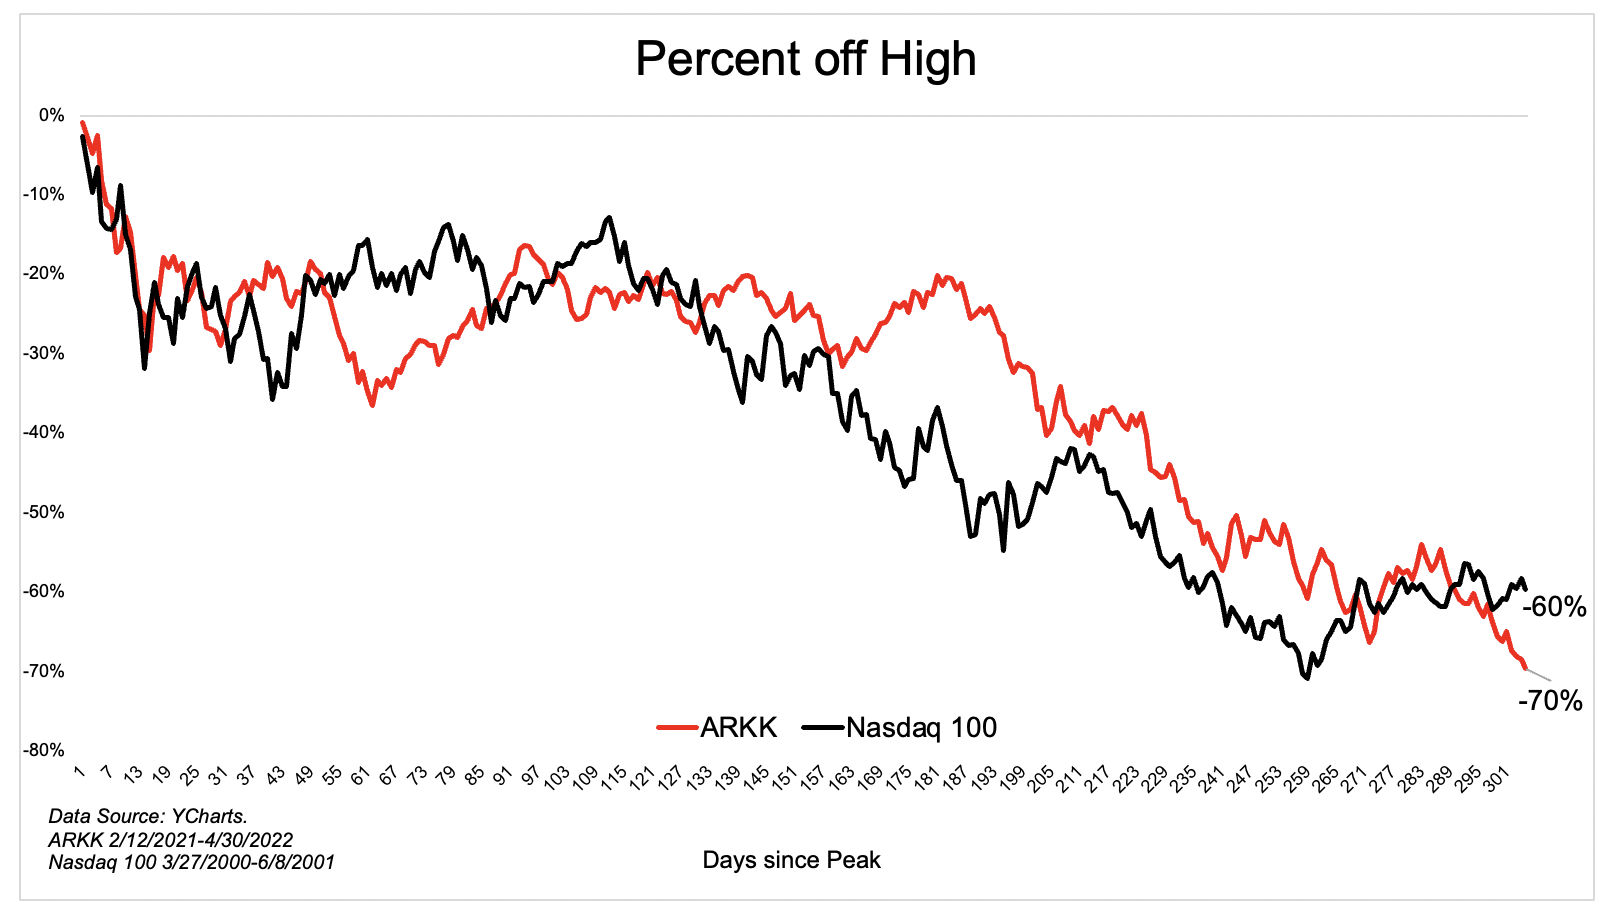
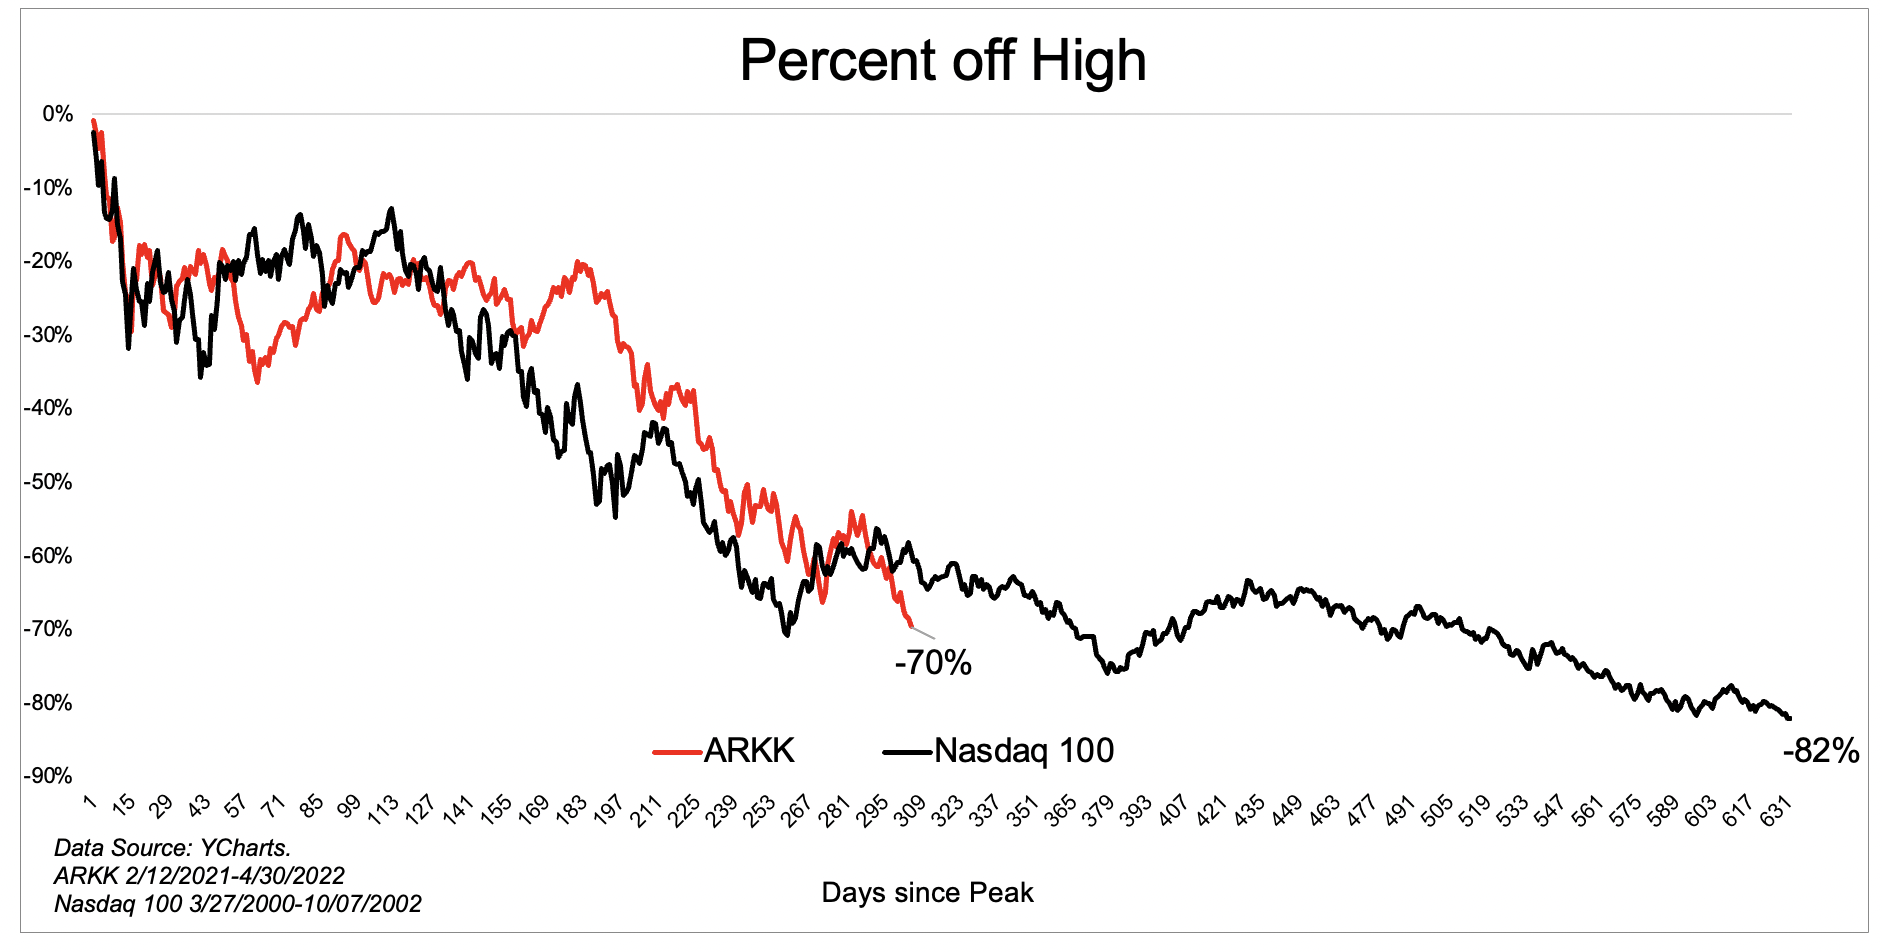
At the epicenter of this is the Ark Innovation ETF (ARKK), which peaked 306 days ago. Since then, it’s lost 70 cents on the dollar. The best comp we have for such a spectacular rise and fall is the dotcom bubble and bust. It’s hard to believe, but ARKKs 70% decline from the top is worse than what the Nasdaq 100 experienced over the same number of days from its high back in March 2000.
I won’t make a call as to whether ARKK will play out the same way, who knows, but here’s what the full picture looks like. The Nasdaq 100 would ultimately lose 82% of its value from peak to trough. As you know, the difference between down 60% and down 82% is not 22%. It would take the Nasdaq 100 another 327 days to bottom and would shed another 56% when all was said and done.
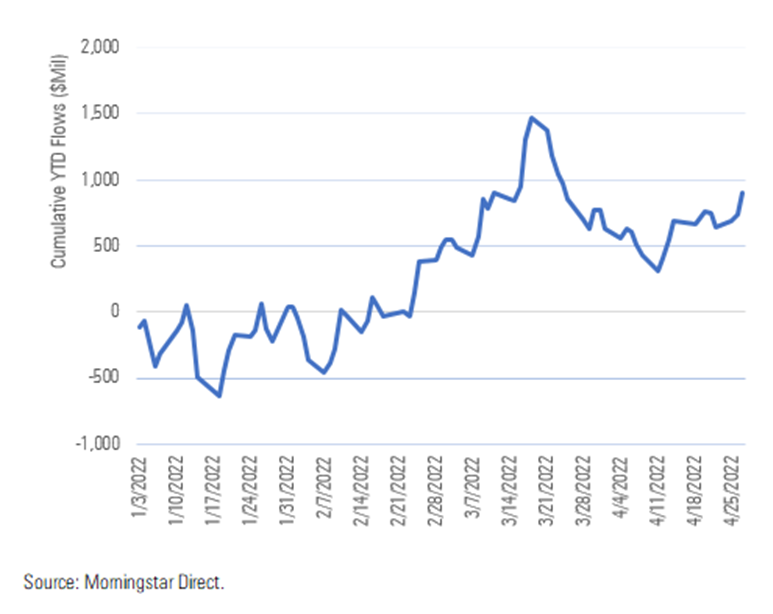
I don’t have fund flow data going back to the dotcom blowup, but it’s safe to assume that investors ran for the exits. So far, we’re seeing the opposite with ARKK. Investors are still piling in. Almost $1 billion in new money has come into the fund since the beginning of the year, according to Ben Johnson. Are these new investors thinking they’re buying on sale? Is it current investors doubling and tripling down?
Investors usually run from fires. This time they’re running towards it. Time will tell if they get rewarded or burned.
Michael Batnick is a managing partner at Ritholtz Wealth Management. He is the co-host of Animal Spirits, What Are Your Thoughts, and The Compound and Friends. For disclosure information please see here.
Get a Full Investor Curriculum: Join The Book List
Every month you'll receive 3-4 book suggestions--chosen by hand from more than 1,000 books. You'll also receive an extensive curriculum (books, articles, papers, videos) in PDF form right away.