The 60/40 portfolio has been declared dead a million times over the last decade. Despite such claims, it’s continued to defy the grim reaper. Before we get into that, just a few things on today.
With Powell’s comments that a 75 basis point rate hike was not in their plans, risk assets shot up. It’s not a huge surprise given the damage we’ve seen in recent weeks. I’m not saying I called it, I definitely didn’t, but these sorts of moves only happen during oversold markets. Of the twenty-four previous times that we’ve seen a 3% move, the S&P 500 was in a 14.5% drawdown, on average.

So, was that it? Is the v-shaped recovery back on? Not so fast. I’ll come back to this in a minute, but first, the 60/40.
This simple portfolio is undefeated as far as investment strategies go. An 11% average annual return with 83% of all years positive (going back to 1976) is about as good as you’re going to get.
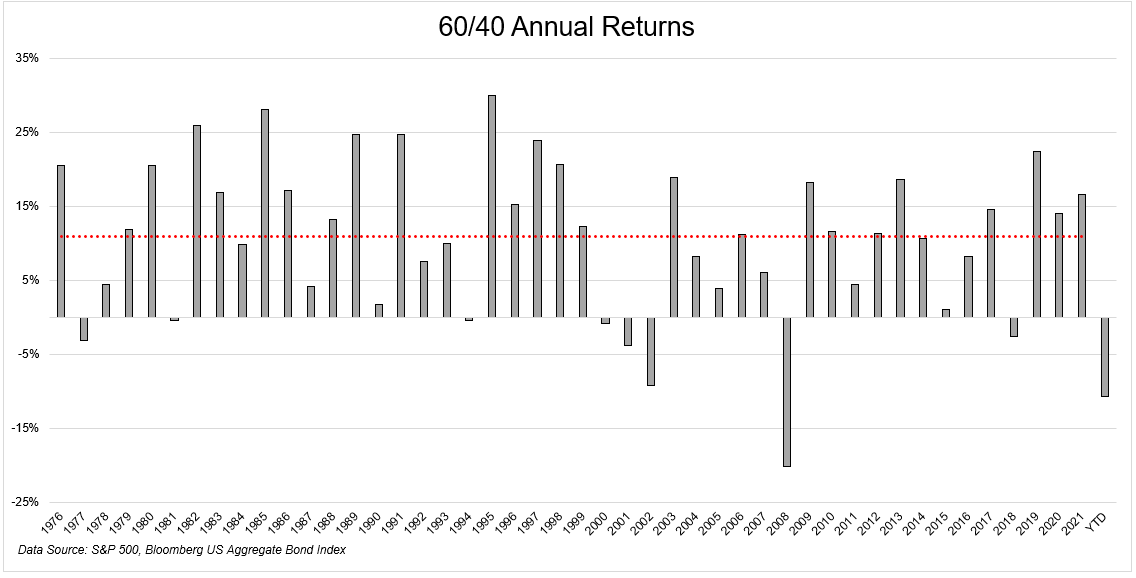
It will get harder from here, no doubt. There’s just no way that the 15% annualized returns of the S&P 500 will persist indefinitely. There’s also no chance that bond investors will receive the same 1.8% annualized return. Hey, wait a minute. Bond returns should actually exceed that! With the 10-year yielding ~3%, we should expect that portion of our portfolios to do better in the coming years.
But even with that 3% return, and generously assuming a 6-8% return for stocks, we’re talking 5-6% for a 60/40 portfolio, way less than the 10% we’ve gotten for the past decade. So is it dead? Come on. Harder? For sure.
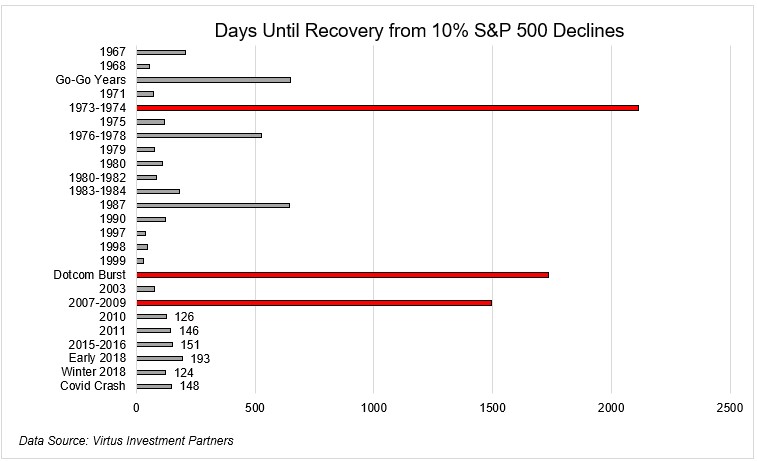
One thing I’m confident is dead is the v-shaped recoveries that we’ve grown accustomed to in the past decade. I was thinking about this after reading some commentary from Joe Terranova about 10% pullbacks in the S&P 500 and how long it took to recover*. You can see how quickly we’ve recouped losses in recent years. The 35% peak to trough decline in 2020 was erased in just 148 days.
I remember first hearing about v-shaped bottoms in 2014. I got on a plane to Boston during the Ebola outbreak in the fall of 2014, and by the time I came home, the correction was over. It was the second time that year we experienced that, and that dynamic would come to define this mantra of our time: Buy the dip. The chart below shows all the 5% corrections since we took out the GFC highs in 2013. I think this is over.

While today’s action is eerily reminiscent of prior v-shaped recoveries, I just don’t see it happening this time around. The obvious difference between today and all those prior periods is that the federal reserve was extremely accommodative. Zero-interest rates with an expanding balance sheet will have this sort of impact. To state the very obvious, that’s not the world we currently live in.
I’m not saying that stocks are doomed or that we’ll never get new highs. In fact, I’m positive that we will be at new highs, eventually. All I’m saying is don’t expect that to happen thirty days from now. The market we’ve all grown accustomed to isn’t the market we’ll experience going forward. It’s going to get harder from here.
*There are 10% corrections within longer bear markets. The GFC didn’t regain its highs until 2013, but experienced corrections in 2010 and 2011

