The S&P 500 gained 6.4% last week, the second-best post-pandemic performance for the large-cap index. For a moment there, we were out of bear-market territory, bouncing to an 18.5% decline from all-time highs. Now, it’s a bear market again ¯\_(ツ)_/¯
All silliness aside, calls for a bottom appear premature.
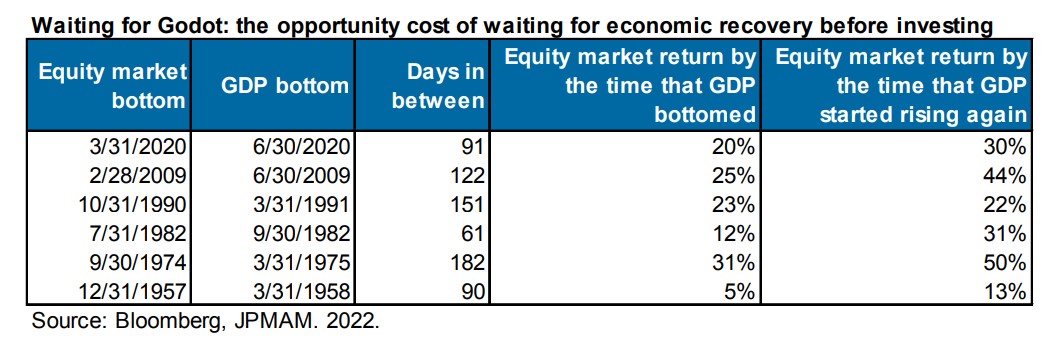
Michael Cembalest and his team did some work on what you want to be on the lookout for, and we’re not there quite yet. They said that PMI surveys have historically been the best leading indicators, and so you’re going to want to see that bottom. It hasn’t. He also pointed out in the chart below, that over the last few decades, we’ve seen interest rates top prior to equity markets bottoming (gray line). So we’re 0 for 2.
Economic data is backward-looking, which is why it tends to bottom after the stock market. Cembalest shows that on average, stocks bottom 116 days before the economy does. That’s a long time. The news will get worse, but the market will stop reacting to it. We’re not there yet.
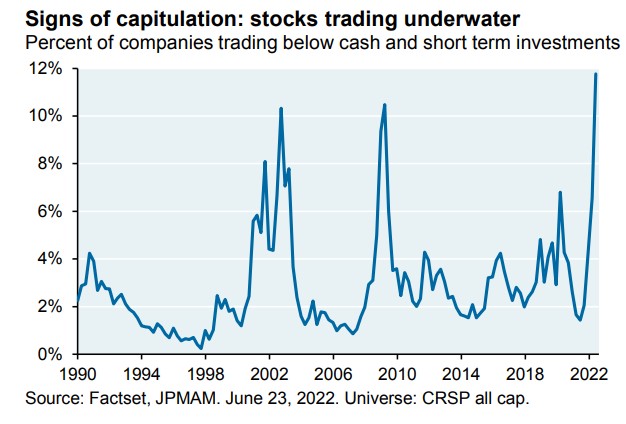
While it’s too early to call a bottom, there are some signs of capitulation (ARKK flows aside). The companies trading below their cash levels are at the highest levels in the last few decades.
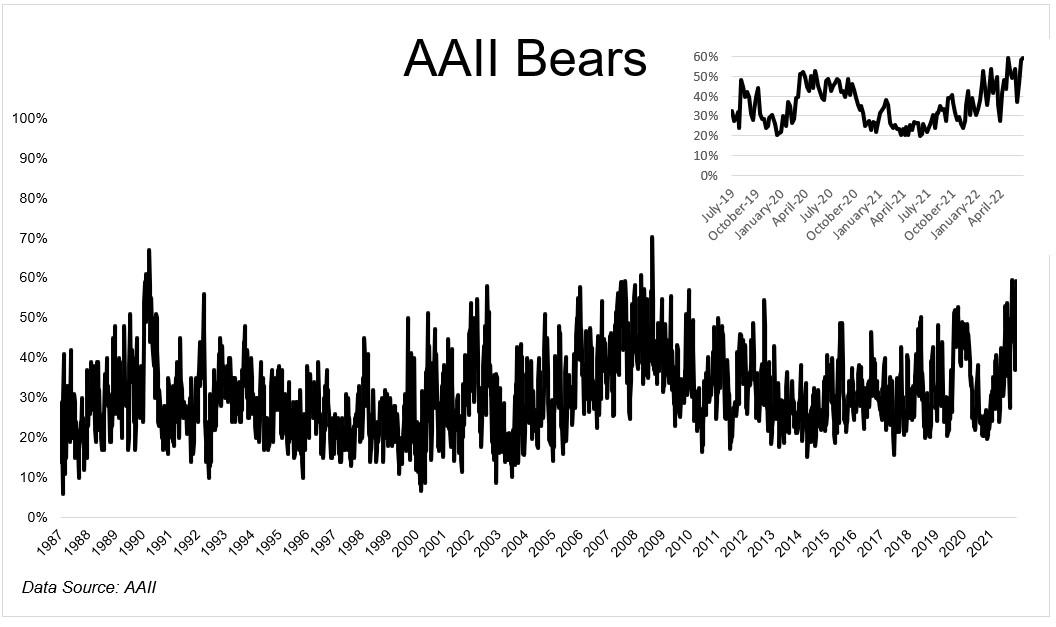
And investors, at least the ones polled by AAII are as bearish as they’ve been since the GFC.
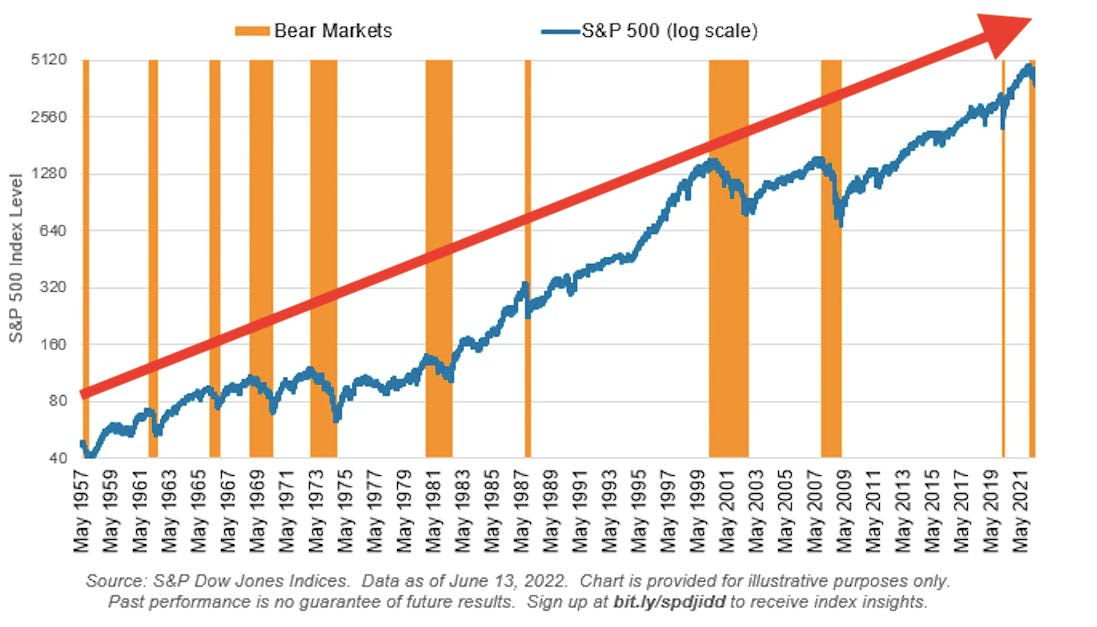
Every bear market is unique, but they all share one thing in common; they end. Sam Ro has a similar takeaway, saying, “the most important pattern in history’s bear markets is that the market has always come out on top — and then some.”
Josh and I are going to cover this and much more on tonight’s What Are Your Thoughts?
Michael Batnick is a managing partner at Ritholtz Wealth Management. He is the co-host of Animal Spirits, What Are Your Thoughts, and The Compound and Friends. For disclosure information please see here.
Get a Full Investor Curriculum: Join The Book List
Every month you'll receive 3-4 book suggestions--chosen by hand from more than 1,000 books. You'll also receive an extensive curriculum (books, articles, papers, videos) in PDF form right away.