Investors got used to spending a lot of time near all-time highs over the last decade. There have been dips and corrections and a couple of bear markets, but all of them were quickly erased. The V-shaped recovery was something investors could hang their hats on. Well, as the saying goes, we’re not in Kansas anymore. It really is different this time.
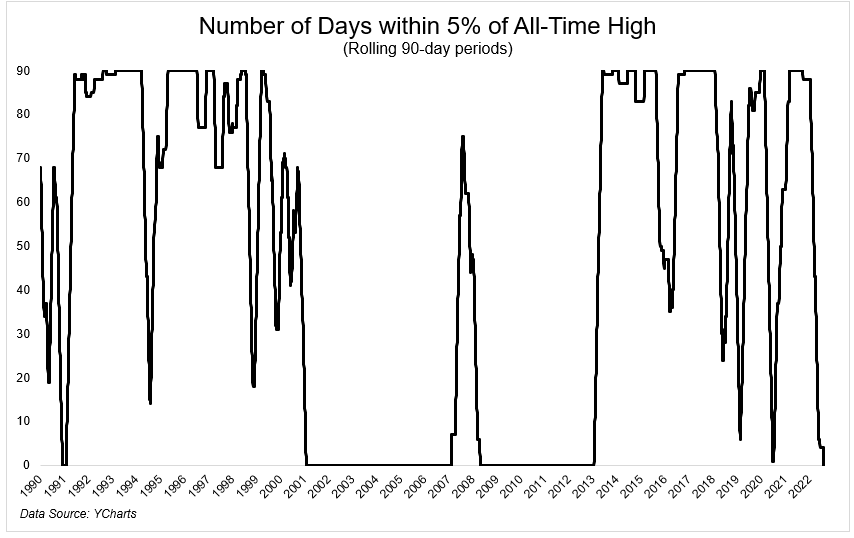
For the first time since January 2013, the S&P 500 has not been within 5% of its all-time high for 90 days.
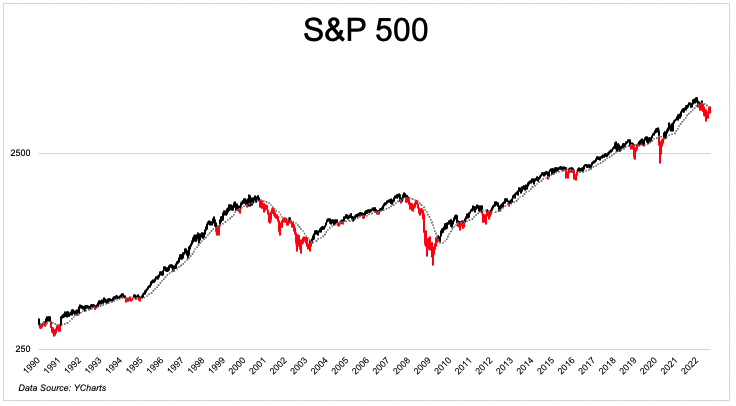
An easy way to measure the primary trend of the stock market is by using the 200-day moving average. The risk/return profile for stocks changes dramatically depending on which side of the line you’re on. The annualized standard deviation for the S&P 500 is 12.6% when it’s above the 200-day and 24.5% when it’s below it. The average 1-year return is 10.6% when the S&P 500 is above its 200-day and 6.9% when it’s below.
This sounds painfully obvious, but it’s true; stocks tend to go lower when they’re going down. And you can see in the chart below (red is when S&P 500 is below 200-day) that they’ve been going down for some time now.
In fact, the S&P 500 has been below its 200 day for 99 days, the longest stretch since the GFC.
This simple indicator is not a sure thing. Nothing is. But it can be helpful if for no other reason than to mentally prepare yourself for the higher probability of increased volatility and lower returns.
One of the keys to investing, and so many other things in life, is expectations. You know how to stay dry if there’s an 80% chance of rain; Grab an umbrella and wear a raincoat. The rain might not come, but it’s better to have an umbrella and not need it than to need an umbrella and not have it.
Josh and I are going to talk about this and much more on tonight’s What Are Your Thoughts?
Michael Batnick is a managing partner at Ritholtz Wealth Management. He is the co-host of Animal Spirits, What Are Your Thoughts, and The Compound and Friends. For disclosure information please see here.
Get a Full Investor Curriculum: Join The Book List
Every month you'll receive 3-4 book suggestions--chosen by hand from more than 1,000 books. You'll also receive an extensive curriculum (books, articles, papers, videos) in PDF form right away.