Amazon is the sixth largest company in the S&P 500 by market cap. Incredibly, they wear this crown despite having earned less than 121 different companies over the previous twelve months. It’s no secret that Amazon is an expensive stock. Even if Bezos were to capture 100% of the total retail revenue, its price-to-earnings ratio would still be 63! Amazon’s stock has received a lot of attention over the years because its performance has been off the charts while maintaining a nosebleed valuation that has been the envy of their competition.
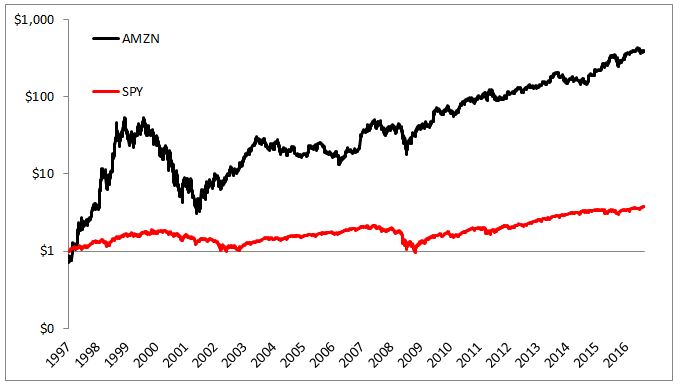
Amazon is the third best performing S&P 500 stock since going public in 1997 (trailing only Monster Beverage and Celgene). Below you’ll see the 38,155% return since its IPO, which is 100 times better than the index over the same time. Each dollar invested at the IPO has compounded at 35% per year, which I’m pretty confident will not continue. If it did, its market cap would exceed $5 trillion by 2025.
This massive outperformance has led to an explosion in hindsight bias, with investors fooling themselves into believing Amazon’s ascent was somehow obvious or inevitable. But the truth is this 38,000% return was handed to nobody, it was earned through enormous dedication. Actually, lunacy might be a better way to describe it, being that you had to be some sort of sociopath- void of any human emotions, to earn these monstrous gains.
Below is an incredible chart I’ve shared before, which shows that Amazon’s path to a 38,000% return was filled with heartache, despair, and a nausea.
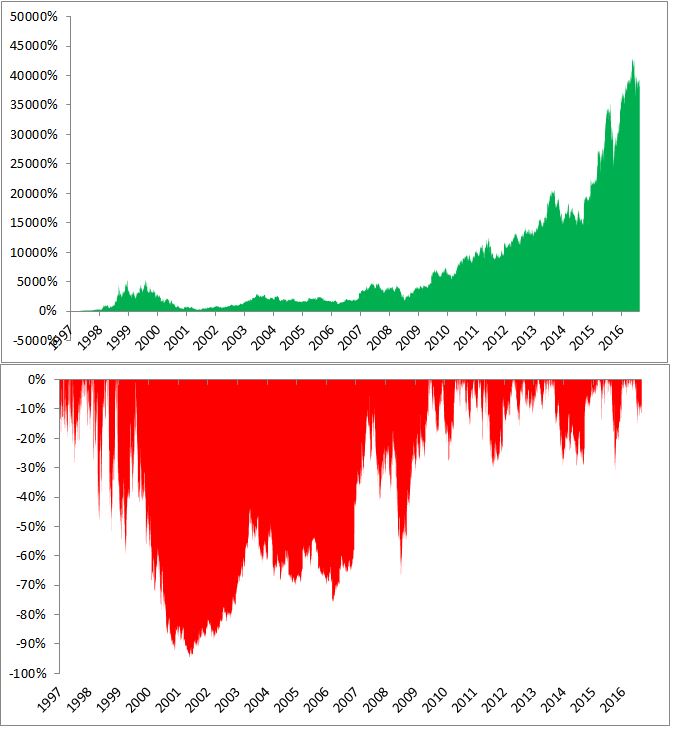
Some of the losses Amazon has experienced along the way have been totally insane. It fell 15% in just three days 107 different times, it has lost 6% in a single day 199 times, and it fell 95% from December 1999 to October 2001.
People anchor to January 1 for diets and exercise as well as investment returns. Every year the clock resets. So below I show the max intra-year drawdown, i.e. how far the stock fell from its high in each calendar year. Amazon has had a double-digit drawdown each year since going public and a 20% drawdown in 16 out of 20 years. The average DD is -36% (median is -30%). I wanted to provide a reference point of just how insane this is, so I included the Dow (sue me) in black. You’ll notice that Amazon had far deeper drawdowns in every year but 2009 and 2015

People waste way too much time looking for the next Amazon, but I get it, it’s part of what makes investing exciting. So if you’re going to search for a potentially life-changing investment, here are a few things you should consider:
- A lot of people spend their life looking for the next Amazon. Few people ever find it.
- Sticking to a boring 60/40 portfolio is hard enough. Focus on getting the big things right.
- If you can’t help yourself, limit yourself to a few speculative ideas a year. Two or three sounds about right.
- Keep the amount you wager small. No more than 1 or 2% of your portfolio.
- Earning 100% on a stock can be an emotional roller coaster. Earning 10,000% can lead to a lot of sleepless nights.
- Let’s say you do find a unicorn; As the dollar amount you have invested grows, you become much more sensitive to drawdowns.
- Just because you take big risks, that does not mean you’re entitled to big rewards.
Source:

