Chart Crimes

Stretching a linear axis vertically to prove a point. Don’t do this.

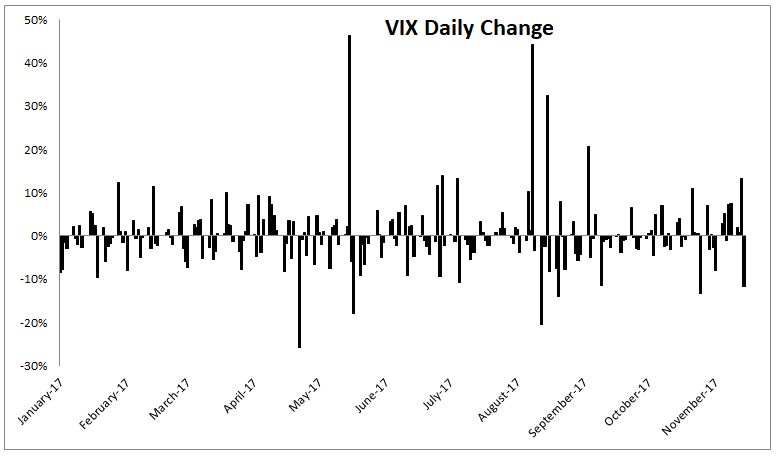
Some things should be shown as a level, not a percent change. The ten-year yield going from 2% to 2.1% is not a 5% change, it’s a ten basis point move. The same holds for the VIX. Don’t do this.

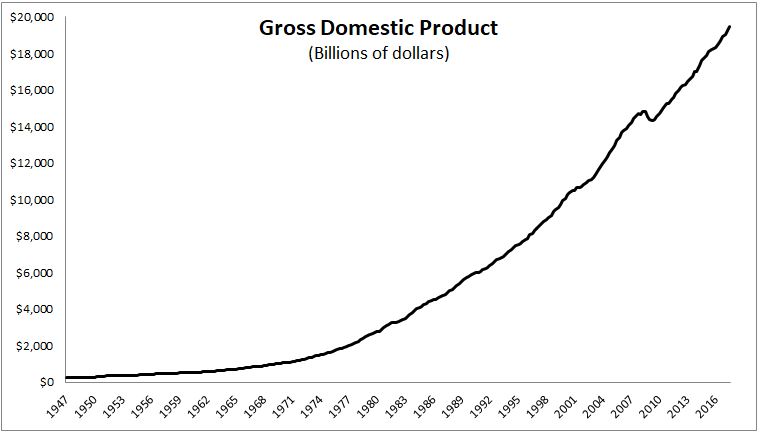
So many things wrong with this one. This chart provides zero information. Comparing dollars across multiple decades have to be real, not nominal, and this should be shown as a percent change, year-over-year works.

Using the lowest point in a cycle to support your narrative is not a good look…

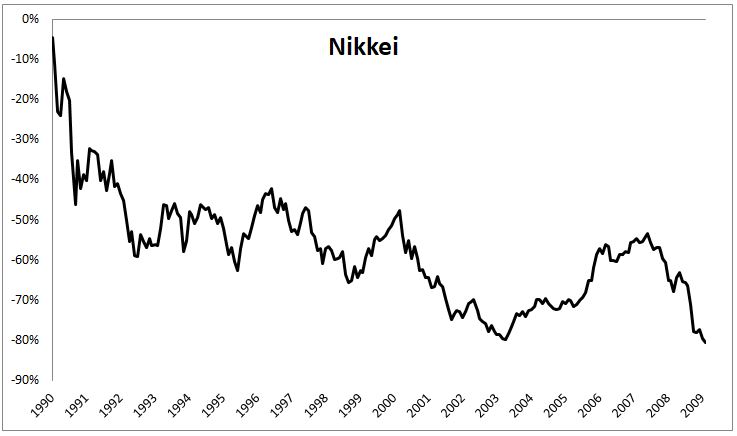
…Neither is choosing the high point.

Showing the percent change on an asset whose interest or dividend is a big percent of the total return is a big no no. The price of BND is only up 6% over the last decade, but the total return is 48%.

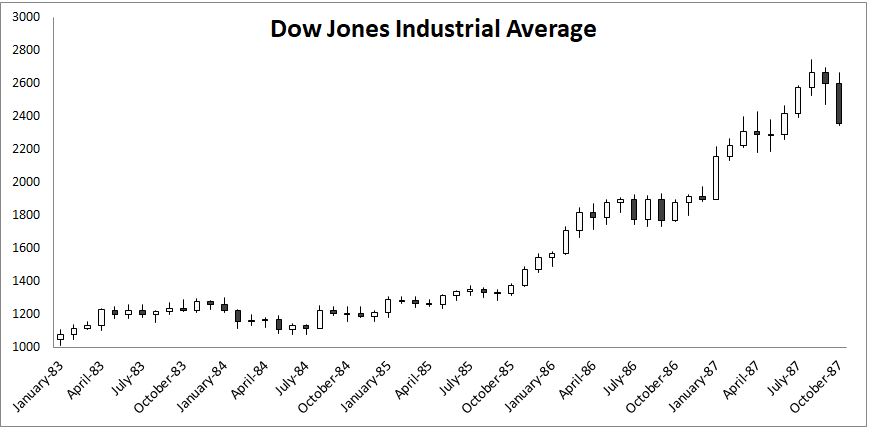
Do not use monthly candle stick charts in the middle of the month, or weekly candle sticks in the middle of the week. This is what you would have seen on October 15, 1987…

…The real thing looks a little different.

“I’m expecting this to resolve in an explosive fashion, one way or the other.” Technical analysis on economic charts. Just don’t.

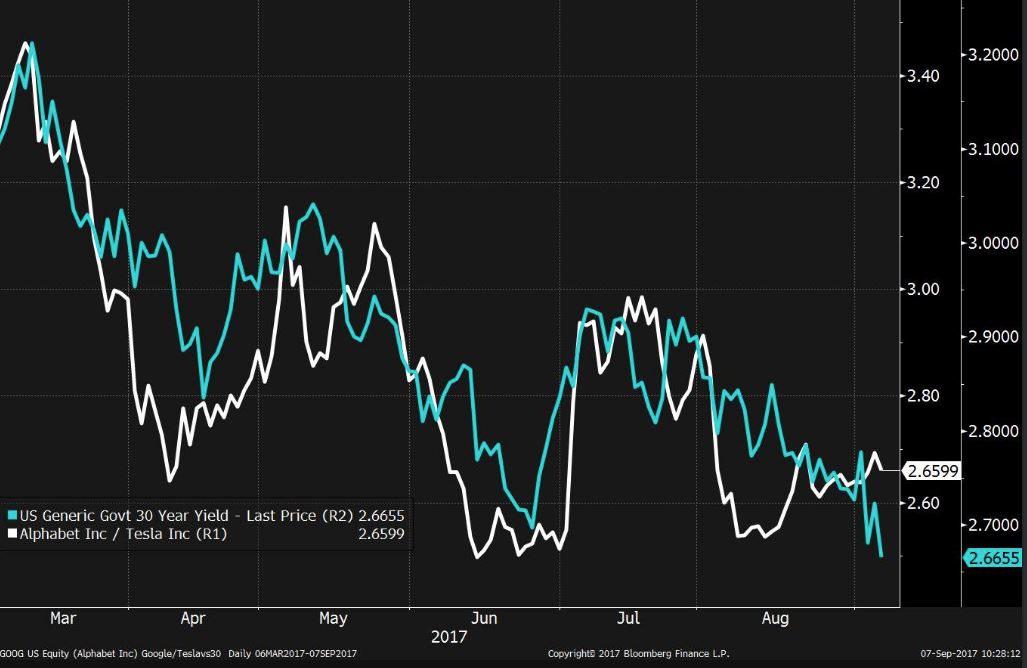
Comparing lines that have absolutely nothing to do with each other is a chart crime. This gem comes from Joe Weisenthal 

This is hardly an exhaustive list. Chart manufacturers have endless ways to fool you. Stay woke.

This content, which contains security-related opinions and/or information, is provided for informational purposes only and should not be relied upon in any manner as professional advice, or an endorsement of any practices, products or services. There can be no guarantees or assurances that the views expressed here will be applicable for any particular facts or circumstances, and should not be relied upon in any manner. You should consult your own advisers as to legal, business, tax, and other related matters concerning any investment.

The commentary in this “post” (including any related blog, podcasts, videos, and social media) reflects the personal opinions, viewpoints, and analyses of the Ritholtz Wealth Management employees providing such comments, and should not be regarded the views of Ritholtz Wealth Management LLC. or its respective affiliates or as a description of advisory services provided by Ritholtz Wealth Management or performance returns of any Ritholtz Wealth Management Investments client.

References to any securities or digital assets, or performance data, are for illustrative purposes only and do not constitute an investment recommendation or offer to provide investment advisory services. Charts and graphs provided within are for informational purposes solely and should not be relied upon when making any investment decision. Past performance is not indicative of future results. The content speaks only as of the date indicated. Any projections, estimates, forecasts, targets, prospects, and/or opinions expressed in these materials are subject to change without notice and may differ or be contrary to opinions expressed by others.

The Compound Media, Inc., an affiliate of Ritholtz Wealth Management, receives payment from various entities for advertisements in affiliated podcasts, blogs and emails. Inclusion of such advertisements does not constitute or imply endorsement, sponsorship or recommendation thereof, or any affiliation therewith, by the Content Creator or by Ritholtz Wealth Management or any of its employees. Investments in securities involve the risk of loss. For additional advertisement disclaimers see here: https://www.ritholtzwealth.com/advertising-disclaimers

Please see disclosures here.