Good defense is more important than good offense not just on the football field, but on the investing field as well. Stocks experienced double-digit drawdowns in each of the last eleven decades, with the pain averaging -38%. Let’s take a look at some of the gains and losses to get a better feel of how debilitating these declines can be.
From November 1903 through January 1906, the Dow Jones Industrial Average gained 127%. Over the next twenty-two months, the Panic of 1907 brought about a 43% decline, which wiped out nearly eighty percent of the advance generated through the previous bull market.
The entire bear market from 1966-1982 was particularly excruciating with vicious rallies and disgrosting drawdowns. The selloff from December 1972 through September 1974 ripped a 40% chunk out of the index. The 65% gain over the following 27 months wasn’t enough to make investors whole again.
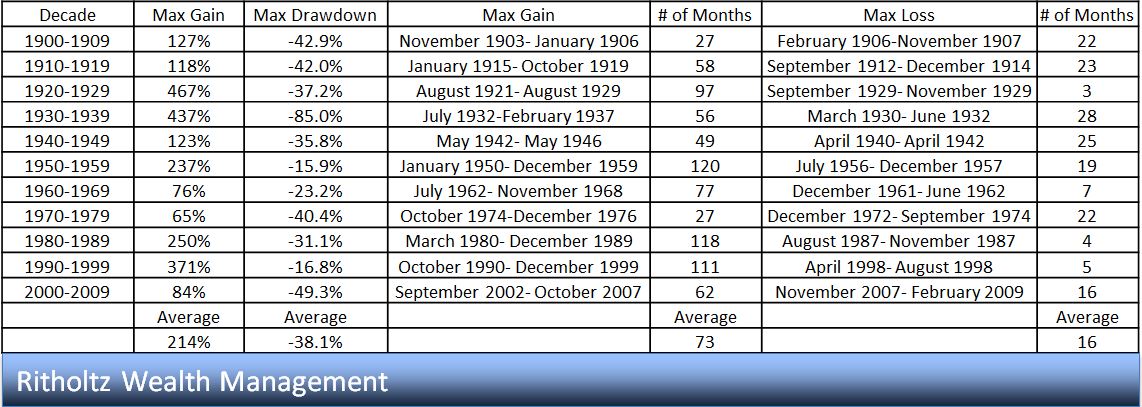
The table below shows the max gains and drawdowns buy and hold investors would have received over each of the previous eleven decades.
Here are a few caveats to the table:
This is price return only (using monthly closing prices), max gains would be even more enticing using total returns.
Nobody bought and held the Dow in 1905.
Nobody actually measures investment returns from decade to decade; this is a mental exercise, leave it at that.
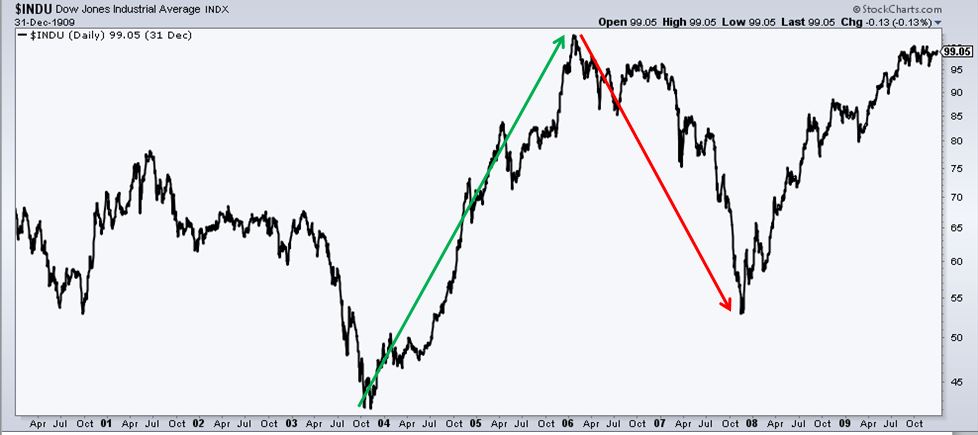
I highlighted two examples (1907, 1974) where 60%+ gains were no match for forty percent drawdowns. However, the truth is that many of these declines were but a pimple on a bull market.
The average intra-decade gain was 223% and lasted for 73 months. The average intra-decade decline was 38% and lasted for sixteen months. Each decade looks vastly different, indicating that one of the only constants in investing is change.
Having a diversified portfolio is the best way for 99% of investors to play defense. There are legitimate ways to limit drawdowns, but of course nothing works every time. It’s likely that in an attempt to avoid volatility, most investors end up avoiding returns. While it’s true that stocks have been in at 20% drawdown 21% of the time, I believe that investors are best served focusing on the fact that stocks have been at or within 5% of all-time highs 43% of the time.

[…] a post last week, I reviewed the biggest drawdowns for the Dow in each of the previous eleven decades. […]