On the podcast this week, Ben and I spoke about an 18 year old who recently won the lottery. She was given the choice of receiving a $1 million lump sump, or $1,000 a week for life. She chose the weekly payment. This is the wrong mathematical decision.
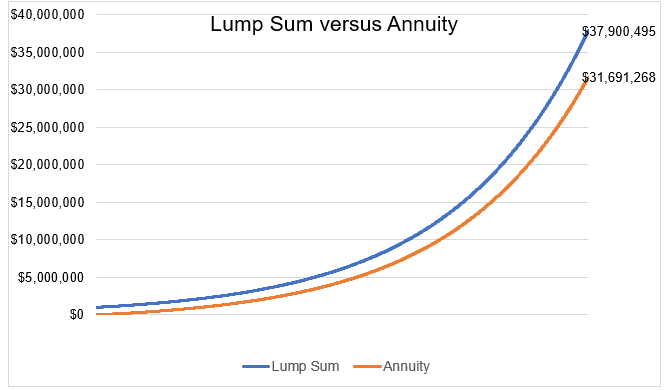
The time value of money says that a dollar today is worth more than a dollar tomorrow, so opting for $1,000 every week instead of the million dollars today doesn’t compute. If she chose to receive the $1 million today and earned 6.25% a year, she would be left with $38 million in sixty years. If she received $1,000 a week and earned 6% on that money, she would have only $31 million over the same time.
You don’t have to be Econompic to poke a few holes in this analysis. First of all, there is not an 18 year old on this planet who would win one million dollars and invest all of it for future consumption. Second of all, I’ve never seen growth like this before. In the real world outside of excel, a 6% compound annual growth rate does not mean 6% annual growth. There are ups and there are downs. There are good years and there are bad years.
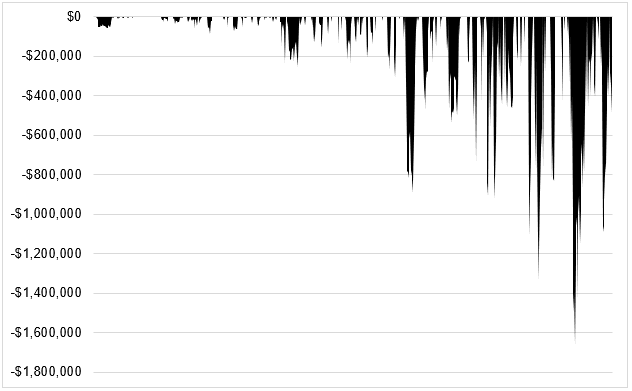
Let’s look at something that has compounded at 6.25% over the last sixty years, five-year U.S. treasury notes. The worst drawdown in nominal percent terms was just -8.9% in the 22nd year, but at that point you’re talking about a $245,000 decline. And as the chart below shows, as wealth grows, even small percent declines become huge dollar declines.
To compound your wealth over sixty years is no easy task, let alone when the starting point is on your 18th birthday with $1,000,000. Which is why decisions like this go beyond numbers in a spreadsheet. Here’s Ed Catmull talking about this idea in Creativity, Inc.
There are limits to data, however, and some people rely on it too heavily. Analyzing it correctly is difficult, and it is dangerous to assume that you always know what it means. It is very easy to find patterns in data. Instead, I prefer to think of data as one way of seeing, one of many tools we can use to look for what’s hidden. If we think data alone provides answers, then we have misapplied the tool. It is important to get this right. Some people swing to the extremes of either having no interest in the data or believing that the facts of measurement alone should drive our management. Either can lead to false conclusions. “You can’t manage what you can’t measure” is a maxim that is taught by many in both the business and education sectors. But in fact, the phrase is ridiculous- something said by people who are unaware of how much is hidden. A large portion of what we manage can’t be measured, and not realizing this has unintended consequences. The problem comes when people think the data paints a full picture, leading them to ignore what they can’t see. Here’s my approach: Measure what you can, evaluate what you measure, and appreciate that you cannot measure the vast majority of what you do. And at least every once in a while, make time to take a step back and think about what you are doing.
Using excel shows you how a robot should allocate its lottery winnings. It doesn’t show you that 70% of human lottery winners go bankrupt. Relying on data is almost always better than trusting your intuition, but there are some things that should not and cannot be quantified.

