Josh Ben and I did a video about how to build a recession proof portfolio.
These are the 12 charts I used for my talking points.
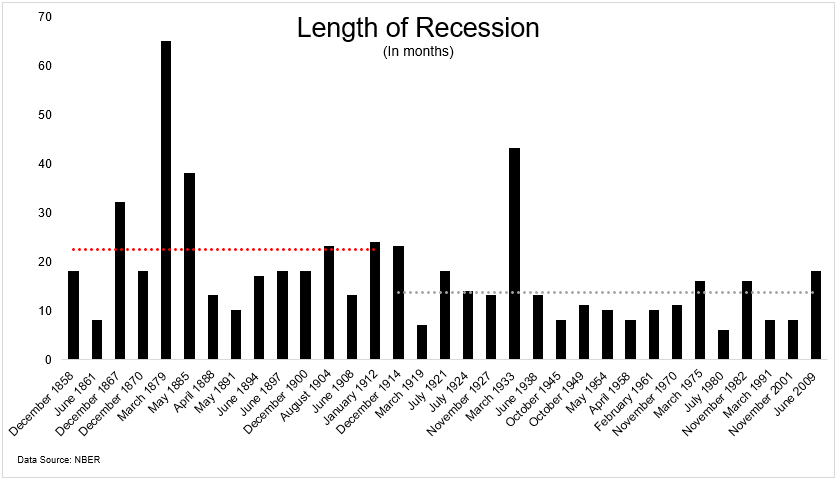
You can see that recessions have become less frequent with the passage of time.
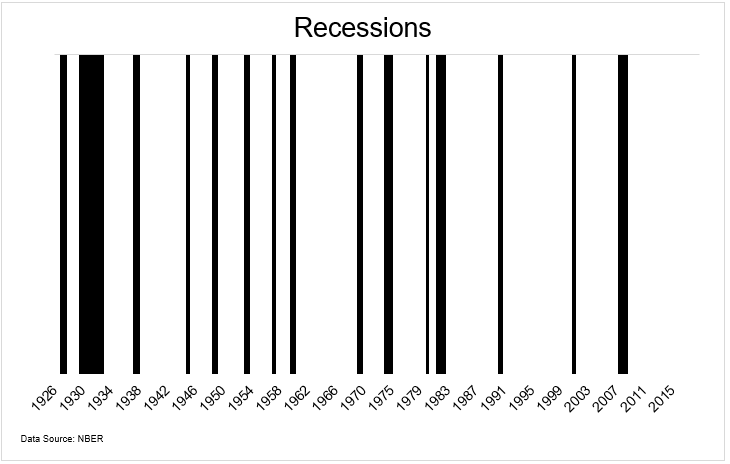
This makes sense as the economy has matured.
They’ve also been shorter in duration.
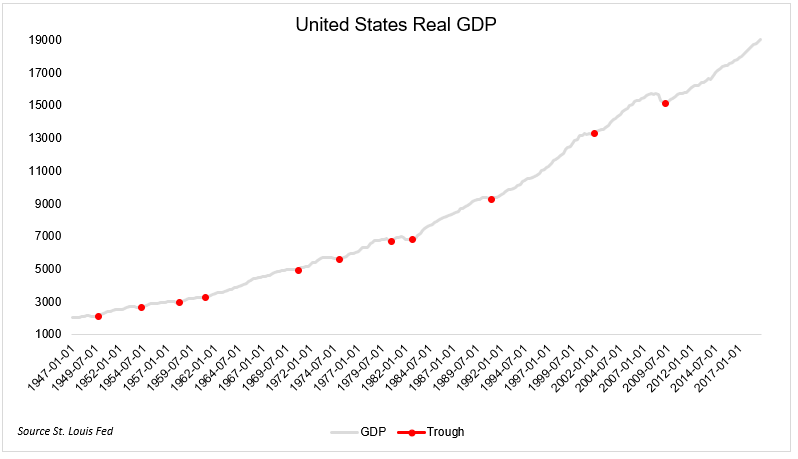
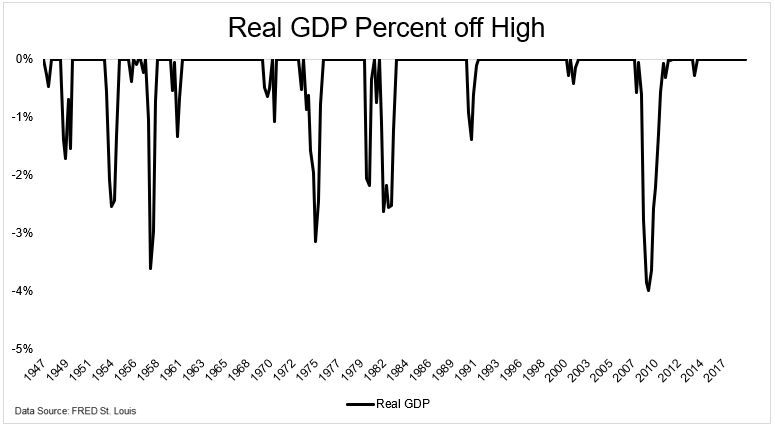
The United States is home to one of the most dynamic economies the world has ever seen. The trough of every recession since WWII has experienced a higher high.
In fact, did you know that there can be a recession without a contraction in GDP? That’s just what happened in the aftermath of the tech bust. There was a sharp contraction in manufacturing activity and an expansion in the unemployment rate, but real GDP never went negative.

In fact, GDP is so durable that even in during one of the worst economic downturns of all-time, real GDP never fell more than 5%
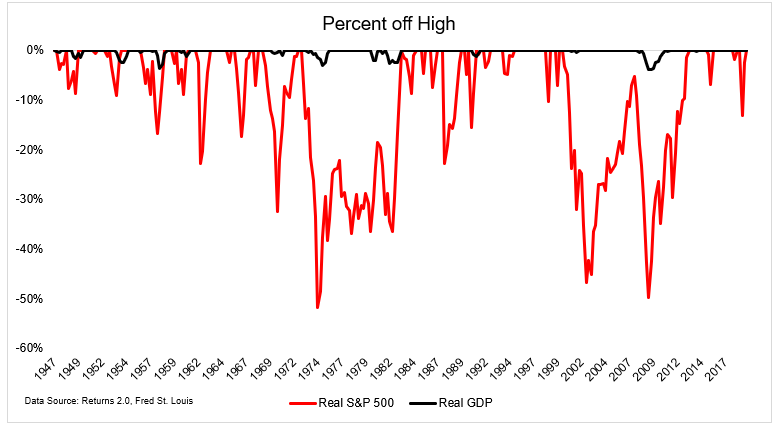
Stocks are much more sensitive to the economy than the economy is to itself.
Can you use economic data to time the stock market? No, you cannot. Let’s use the unemployment as an example. Like most economic data, the unemployment rate is a lagging indicator. It continues to rise after the recessions is already over, so if you were to use this as a signal to re-enter the market, you’d come in well after the market already bottomed.

This chart shows that the stock market is already well off the lows by the time unemployment peaks. The smartest people in the world can’t use the economy to time the market. This is not a game worth playing at home.

Well what if you just used the official start and end dates of the recession to get in and out of the market? Would that Work? Sure, your money would grow, but not by nearly as much had you just left it alone. And you wouldn’t have avoided the downturns either.
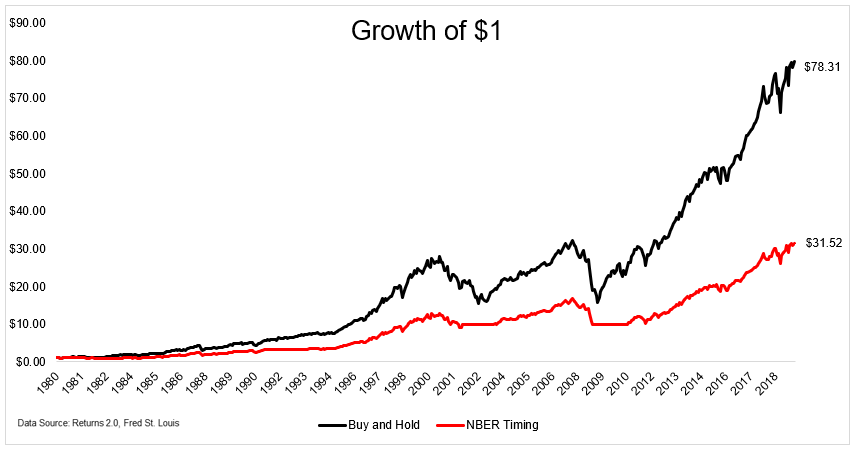
That’s because the National Bureau of Economic Research doesn’t tell us we’re in a recession until we’re well underway and they don’t tell us it’s over until it well after it already ended. For example, the stock market bottomed in March, 2009 and the recession ended in June. They didn’t declare it over until September, 2010.
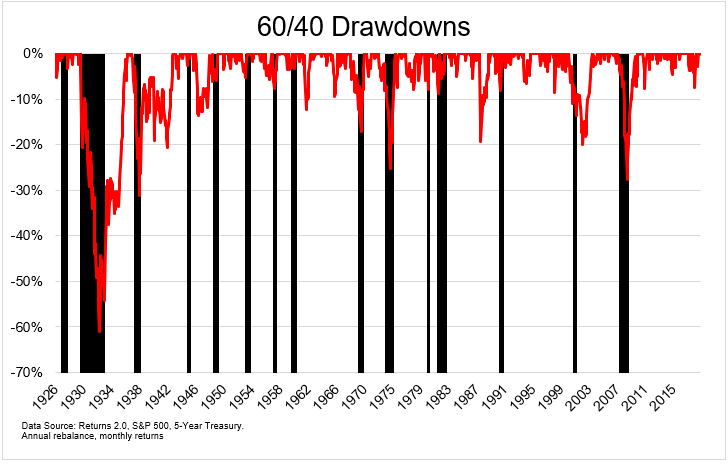
Calling a recession is hard. Timing it is harder. Getting out before it hurts your portfolio and getting back in when the coast is clear is impossible. So rather than attempting to avoid a recession, you should rather focus your energy on surviving one. In the GFC, a 60/40 portfolio fell 27% peak to trough. That is about as bad as it’s going to get. If you can’t stomach this, the answer is simple, hold more bonds. And if The Great Depression happens again you’ll have much bigger things to worry about than your portfolio.
The good news is you don’t have to hold only U.S. stocks and bonds. You could add trend following or managed futures or long/short portfolios or commodities if you want to further diversify. Gold, the poster child of alternative assets has done fairly well during the past few economic downturns. On average, it has gained 14% during recessions since 1970 (median 6%).

Recessions are an unavoidable part of investing like death is an unavoidable part of life. It doesn’t pay to waste too much energy focusing on either.

