Slow and Steady

The S&P 500 is up 29%* this year, but it has been more of a grind than a blistering advance. This is fairly common bull markets. You might think that big annual gains are defined by big daily gains, but that’s not necessarily the case.

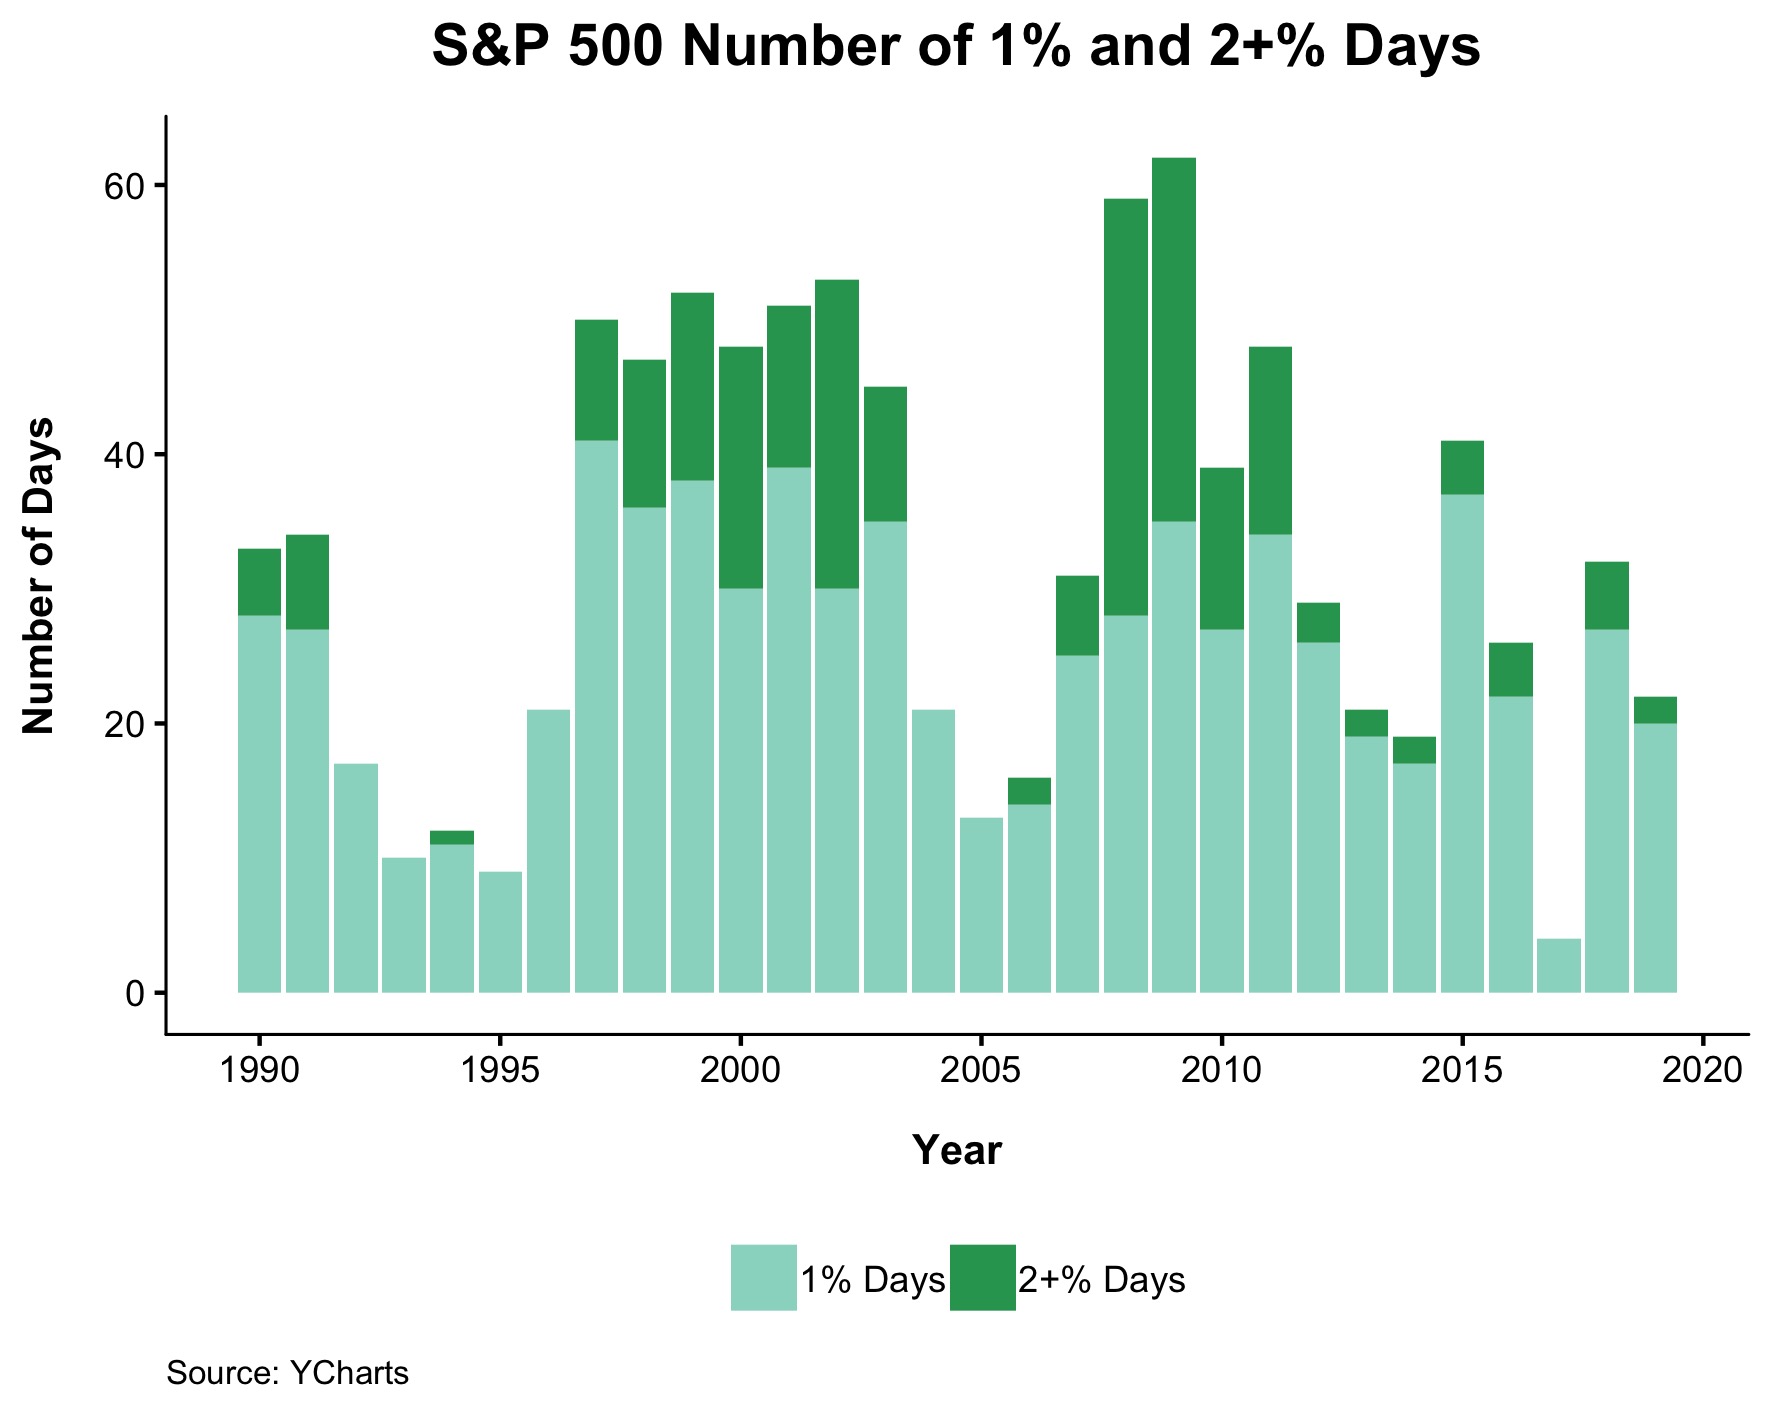
This year there have been 20 days where the S&P 500 gained between 1 and 2%. Last year, that happened 27 times even though the market was down nearly 5%.

In 1995, perhaps the cleanest year ever, the S&P 500 never fell more than 3% from its high and it returned 31%, which was the best annual gain since 1958. But it only rose 1% in a day 9 times and never gained more than 2% for the entire year!

The bars in the chart below show the median annual daily return, the number in white show the annual return, and the red line is average for all days. What you can see is that the median daily return for some of the best years are lower than you might have thought. **

2019 has been an incredible run, hopefully you made the most of this opportunity. If you over traded or held too much cash or were distracted by some headlines, we’ve all been there. Review what went wrong and come up with a plan for next year. It’s never too late to get your affairs in order.

As always, thanks to Nick Maggiulli for the data work.

*For this exercise we used price returns only

**1997 was actually a big year that was defined by big daily gains. It returned between 1 and 2% 41 times and gained more than 2% 9 times

This content, which contains security-related opinions and/or information, is provided for informational purposes only and should not be relied upon in any manner as professional advice, or an endorsement of any practices, products or services. There can be no guarantees or assurances that the views expressed here will be applicable for any particular facts or circumstances, and should not be relied upon in any manner. You should consult your own advisers as to legal, business, tax, and other related matters concerning any investment.

The commentary in this “post” (including any related blog, podcasts, videos, and social media) reflects the personal opinions, viewpoints, and analyses of the Ritholtz Wealth Management employees providing such comments, and should not be regarded the views of Ritholtz Wealth Management LLC. or its respective affiliates or as a description of advisory services provided by Ritholtz Wealth Management or performance returns of any Ritholtz Wealth Management Investments client.

References to any securities or digital assets, or performance data, are for illustrative purposes only and do not constitute an investment recommendation or offer to provide investment advisory services. Charts and graphs provided within are for informational purposes solely and should not be relied upon when making any investment decision. Past performance is not indicative of future results. The content speaks only as of the date indicated. Any projections, estimates, forecasts, targets, prospects, and/or opinions expressed in these materials are subject to change without notice and may differ or be contrary to opinions expressed by others.

The Compound Media, Inc., an affiliate of Ritholtz Wealth Management, receives payment from various entities for advertisements in affiliated podcasts, blogs and emails. Inclusion of such advertisements does not constitute or imply endorsement, sponsorship or recommendation thereof, or any affiliation therewith, by the Content Creator or by Ritholtz Wealth Management or any of its employees. Investments in securities involve the risk of loss. For additional advertisement disclaimers see here: https://www.ritholtzwealth.com/advertising-disclaimers

Please see disclosures here.