After retracing 50% of the losses, stocks are at a crossroads. Before we move forward, let’s step back and simply describe how we got here.
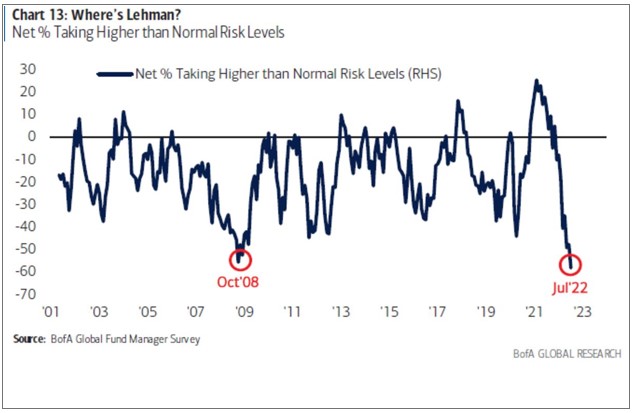
Going into the second quarter, investors got too bearish based on positioning and sentiment. Both individual investors and institutional investors alike wanted no part of stocks.
And then when earnings turned out to be mostly better than feared, on top of inflation expectations coming down, a rally was fueled when many people weren’t positioned for it.
The rally was broad-based, with over 90% of S&P 500mstocks getting back above their 50-day moving average.
While nearly every stock participated in the rally, some did better than others. The best-performing stocks during the bounce were the ones that got beat up the hardest. Last week I ran a screen of companies with a market cap north of $2 billion that was up 30% on the month. 64 of them had no earnings, and the ones that did had an average P/E over 40.
So, people got too bearish, the news was less bad than expected, and a rally ensued. We had a helluva run, and now that has run its course.
Getting back to the stocks that bounced the hardest, they’re now rolling over. Carvana, for example, went from $20 to $58 back to $35. The chart below shows that seven of these former high-flying stocks went from a combined market cap of nearly $500 billion in February 2021 to $100 billion today. I’m not big into predictions, but that $100 billion does not look like it will hold. It looks heavy, to be polite.
Josh and I covered the state of the bounce and much more on last night’s What Are Your Thoughts?
Michael Batnick is a managing partner at Ritholtz Wealth Management. He is the co-host of Animal Spirits, What Are Your Thoughts, and The Compound and Friends. For disclosure information please see here.
Get a Full Investor Curriculum: Join The Book List
Every month you'll receive 3-4 book suggestions--chosen by hand from more than 1,000 books. You'll also receive an extensive curriculum (books, articles, papers, videos) in PDF form right away.