Technology moves the world forward. For the past decade, it’s done the same thing for the stock market.
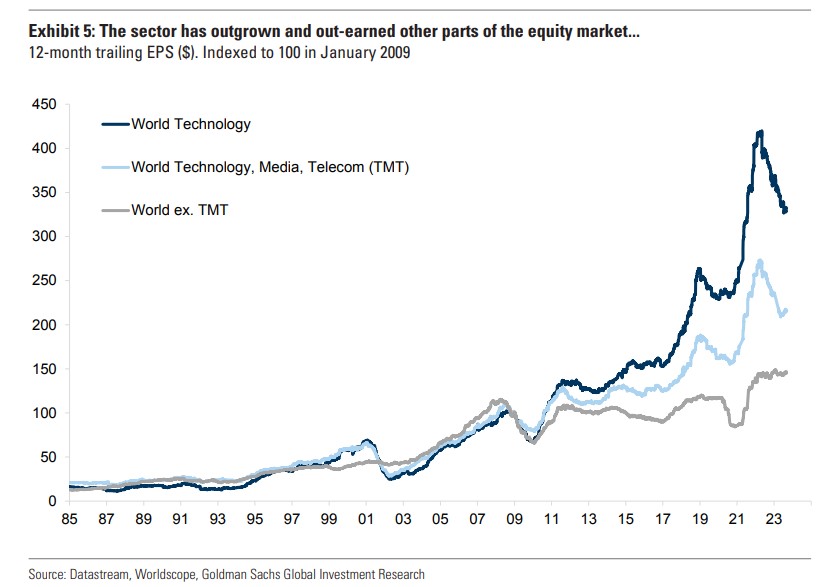
A lot of time was spent debating if the Fed drove these stocks higher with low interest rates. Another theory is that investors are just chasing returns. And yet another is that index funds are making the big stocks even bigger. Bits and pieces of these theories may be true, but the simplest and best explanation as to why technology stocks have been the only game in town is because they’re the best businesses in the world. The shares of these tech giants have grown at a miraculous clip, but it’s hard to make the case that they didn’t earn it. They continue to drive massive growth on both the top and bottom lines.
Since 2015, big tech has bested the rest of the S&P 500 on their top line to an average tune of 12.5% a year. And they’re doing it with much higher margins.

The amount of value technology stocks have delivered compared to the rest of the business universe is staggering.

And yet, we still can’t help but wonder, will this end poorly? The images and stories of the dotcom bust are so ingrained in us that any rally led by tech stocks will inevitably get compared to that period in time.
Goldman put out a wonderful note, Why AI is Not a Bubble, from which I grabbed all these charts, where they compared these tech giants to the ones that crashed and burned. One can easily make the argument that these stocks, some more than others, are discounting a lot of growth. On the one hand, these stocks are not nearly as expensive based on 24-month forward P/E and E/V sales. During the dotcom bubble, both of those metrics are twice where they were today. On the other hand, and probably rightly so, these dominant tech stocks of today are almost three times larger than they were in 2000, once you adjust for inflation.

I say these companies are rightly bigger because their businesses are just so much better. 2000 was a lot more hype, hope, and promise. The return on equity and margins on these businesses are much higher than they were back then. And on a qualitative basis, Apple is so much more important to the consumer and the economy than Intel was. Amazon and Google are basically conglomerates; several businesses in one. They’re integral parts of our day-to-day lives in the way that Oracle never was or could be.

I feel like I’ve written a version of this post twice a year for the last five-plus years because they just keep on delivering. If you look at the data, it’s safe to say that today’s tech giants, by and large, have earned every bit of market cap they’ve accrued up until now. The question is, how long can this continue?
Since 2013, the Nasdaq-100 has had an average annual return of 21%, compounding at 19% a year.

It’s clear to everyone that the dotcom bubble was in fact a massive bubble. And while it’s less clear, to me at least, that these tech stocks are in a bubble, it’s hard to imagine the next decade looking as good as the last one. But then again, I would have said the same thing five years ago. As always, I would avoid making all-or-nothing bets, especially on such a large and polarizing area of the market.

