If you were on the sidelines during the 25 best-performing days since 1970, your returns would have been mush.
This is an example of a factual statement that isn’t truthful, because not even the worst market timer in the world could invest for nearly 12,000 days and miss the 25 best.
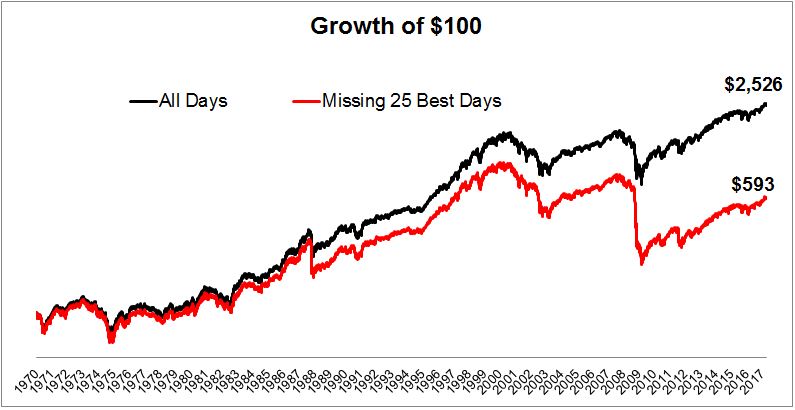
In this example, we need to see the other side, because since 1970, there have been 17 days where the S&P 500 gained at least 5%, and 21 where it lost more than 5%. Therefore, it’s more likely that a coin flipper would have missed big down days than up days.
The chart below shows the other side, and if missing the 25 best days took your returns from a 10 to a 4, then missing the 25 worst days took your returns from a 10 to a 25.
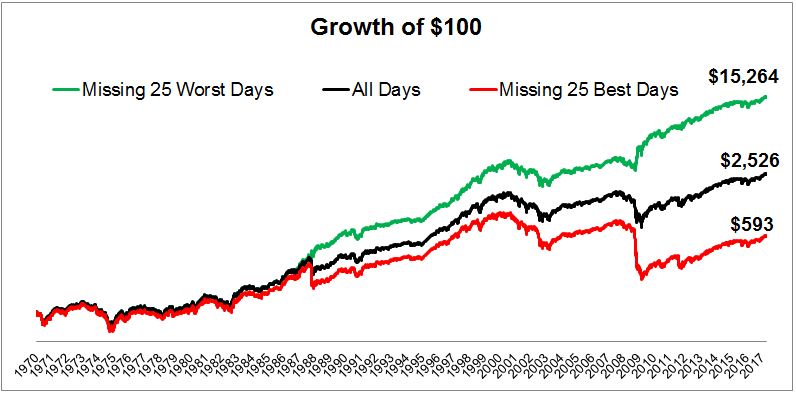
Seeing the other side of things is extremely important in investing and in life. In fact, there’s a famous investor in Los Angeles who works with a guy in Omaha that has a saying about this line of thinking. But some things are best left un-inverted.
Last week I had a post called The Skew, in which I attempted to convey the point that the simple reason why so many managers fail to beat the benchmark is because so many stocks fail to beat the benchmark. People took umbrage with the studies I referenced, but what really ruffled some feathers was the chart below.
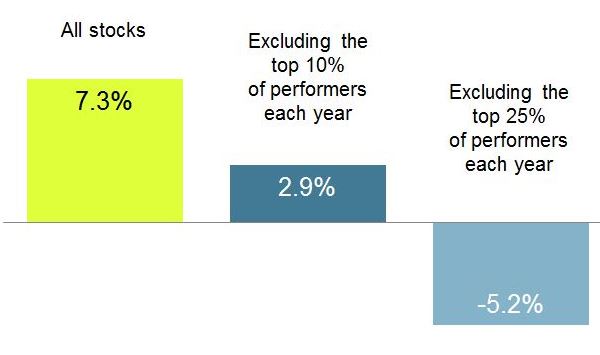
“What if you excluded the bottom performers?”
I’m not surprised that this caused a bit of a stir, in fact I tried to stem the tide, writing “missing just the top 10% of performers each year, which obviously is just as impossible as missing the bottom 10% of performers, but just to illustrate the point.”
I’ll concede the push back is fair however, because avoiding the bottom decile or quartile of stocks would absolutely improve returns in the same way that missing the top performers would hurt them.
Similar to the way I presented data in the previous post, let’s create a universe of 5 securities with 15 possible portfolios. However, in this example, rather than 4 mediocre stocks and one great one, let’s assume four mediocre stocks and one lousy one.
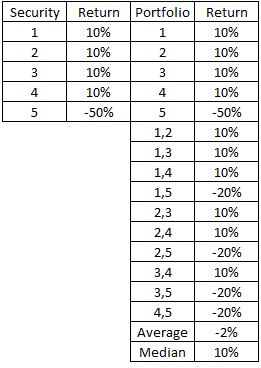
In this simulation, the only thing a “manager” had to do was avoid security 5, and as a result, ten of the fifteen portfolios would have outperformed the average. But this simulation does not translate to the real world, because it’s rare for the median to outperform the average. Ordinarily it’s the few leading the many.
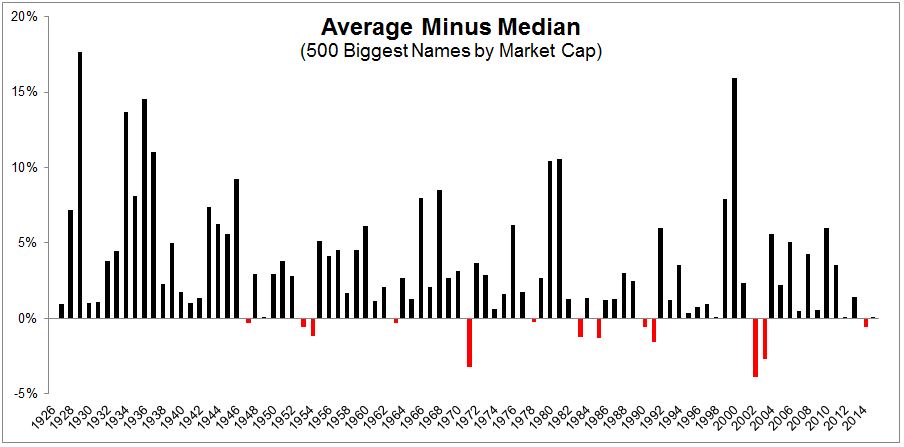
My friends Wes Gray and Jack Vogel at Alpha Architect provided me with data which shows that since 1926, of the 500 biggest stocks by market capitalization, the mean has outperformed the median in 74 of 90 years, or 84% of the time.
The bursting of the tech bubble was such a bountiful environment for active managers because there was an abundance of negative skew. Below is a chart from a Goldman Sachs report, An Rx for Active Management, which shows that active managers have enjoyed more success when value outperforms growth. Notice the darker blue line in the early 2000s, the median stock outperformed the average and the median 3 yr annualized excess returns screamed higher.
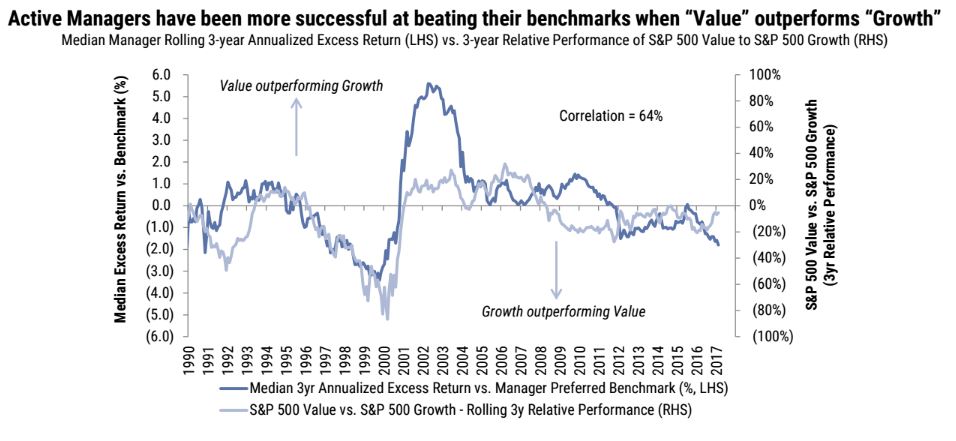
The skew flips in bear markets, which favors active managers. As Patrick O’Shaughnessy has shown: “If you isolate all 12-month periods where the market is down, the worst 20% of stocks in the S&P 500 account for 81.2% of the markets total loss.” Needless to say, those conditions haven’t been present today. The Goldman report notes: “On a net-of-fees basis, Large-Cap managers underperformed by a median 3.0% in 2016, alpha’s worst year since 1998.”
Further evidence on the difficulty of picking stocks comes from an excellent paper, Do Stocks Outpeform Treasury-Bills?, by Hendrik Bessembinder. Below are some of the key findings.
- Just 42.1% of common stocks have a holding period return that exceeds the return to holding one-month Treasury Bills over the same horizon, and more than half deliver negative lifetime returns.
- The median life of a common stock on CRSP, from the beginning of sample or first appearance to the end of sample or delisting, is just 84 months, or slightly over seven years.
- The top thirty firms together accounted for 31.2% of the total stock market’s wealth creation.
- The 1,000 top performing stocks, less than four percent of the total, account for all of the wealth creation.
- The other ninety six percent of stocks that have appeared on CRSP collectively generated lifetime dollar returns that only match the one-month Treasury bill.
- The median stock underperformed the market with an excess lifetime return of -54%.
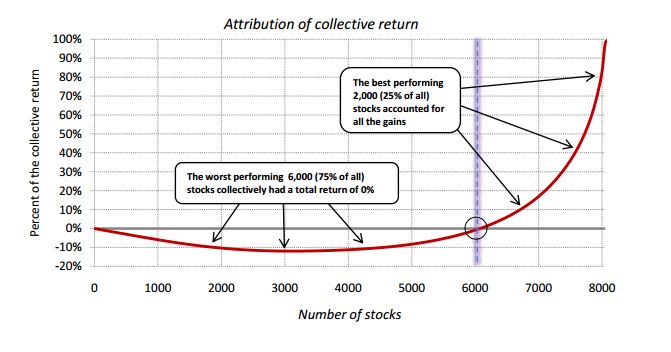
Pictures sometimes tell a story that numbers don’t, so below is a chart that crystallizes the skew, from BlackStar Fund’s The Capitalism Distribution.
If I were in the business of picking stocks, I would do two things: I would try to exclude the worst stocks rather than attempt to pick the best, and I would focus on value, which are really two sides of the same coin.
While the best performing stocks from year-to-year are all over the map, from deep value to high beta and everything in between, the worst performing stocks over time share similar characteristics. So maybe it’s not such a bad idea to be a closet indexer after all, except you should try to be in the closet that screens out stocks that are highly levered, have growing accruals, inventory build, or whatever metrics you prefer.
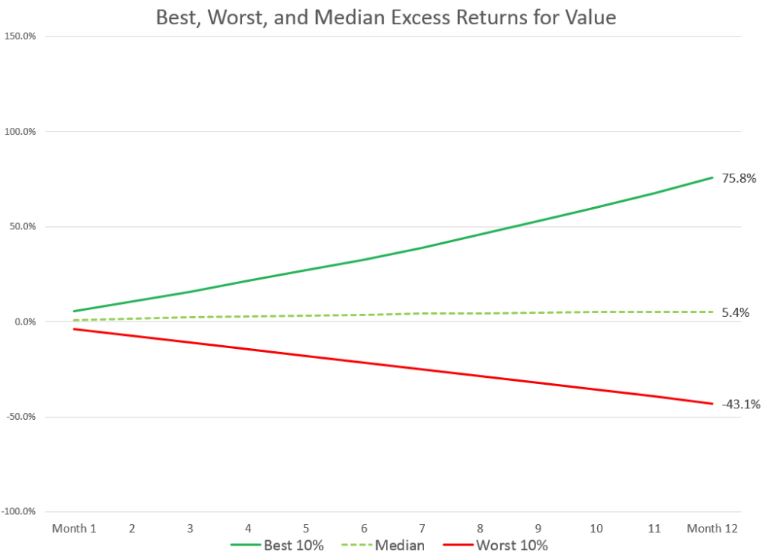
Investors are drawn to glamour stocks because the payoffs can be huge. But while they have great possibilities, they also have bad probabilities, as Patrick has shown. The best performing glamour stocks outperform by 112% on average, but the median result is underperformance of 11%. The best performing value stocks on the other hand, saw a 78% average excess return, while the median saw a 5% average excess return.
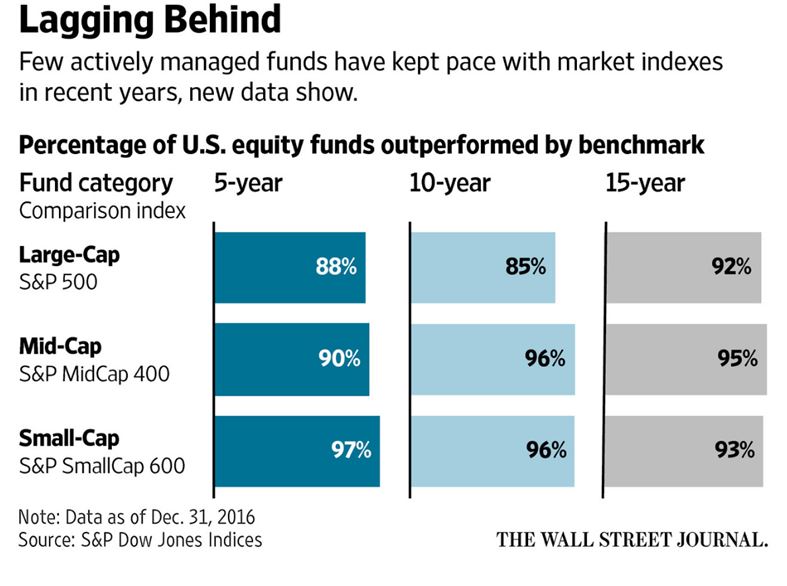
Bessembinder said: “The importance of positive skewness in the cross-sectional return distribution increases for longer holding periods, due to the effects of compounding.” The chart below is the culmination of this, just 8% of large cap managers beat the S&P 500 over the last 15 years.
So maybe there is another side after all, but the results are in. Selecting the mutual funds that are going to pick the best stocks is extremely difficult. If you’re not convinced yet, I’ll just leave this right here:
WT – W0*(1+Rf) T = I0*(R1 – Rf)(1+Rf) T-1 + I1*(R2 – Rf)(1+Rf) T-2 + … + IT-1*(RT – Rf)
Sources:
Do Stocks Outperform Treasury Bills
A few more snippets from Bessembinder’s incredible paper, emphasis mine.
“I assess the likelihood that a strategy that holds one stock selected at random during each month from 1926 to 2015 would have generated a 90-year holding period return that exceeds various benchmarks. In light of the well-documented small-firm effect, it might be anticipated that individual stocks would tend to outperform the value-weighted market. In fact, repeating the random selection process many times, I find that the single stock strategy underperformed the valueweighted market in ninety six percent of the simulations, and underperformed the equal-weighed market in ninety nine percent of the simulations.”
“Approximately 26,000 stocks that have appeared in the CRSP database since 1926 are collectively responsible for lifetime shareholder wealth creation of nearly $32 trillion dollars, measured as of December 2015. However, the eighty six top-performing stocks, less than one third of one percent of the total, collectively account for over half of the wealth creation. ”
“Despite the positive mean returns, most single stock portfolios performed poorly, especially at the 90-year horizon. While a slight majority (50.9%) of single stock strategies generated a positive 90-year holding return, the median 90-year return is only 13.1%, compared to a 90-year holding period return on Treasury bills of 1,923%. Only 27.6% of single stock strategies produced a holding period return greater than one-month Treasury Bills. That is, the data indicates that in the long term (defined here as the 90 years for which CRSP and Treasury bill returns are available) only about one fourth of individual stocks outperform Treasuries.”
“The fact that the overall stock market generates puzzling high long term returns while the majority of individual stocks fail to even match T-bills can be attributed to the fact that the cross-sectional distribution of stock returns is positively skewed.”

