Surveying the Damage

As is usually the case, most stocks are doing worse than the index. While the S&P 500 is mired in a 15% drawdown (as of yesterday’s close), the median stock is 23.5% below its 52-week high.

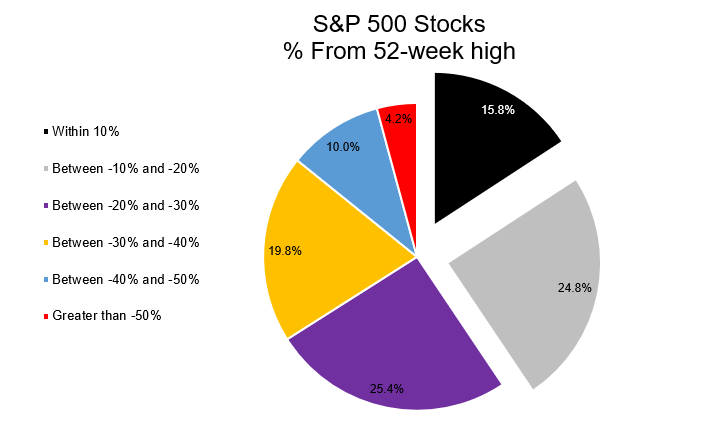
Looking within the S&P 500 (as of yesterday’s close, data from YCharts), things have gotten ugly out there. There are more stocks 50% below their 52-week high (21) than stocks within 5% of their 52-week high (18).

40% of S&P 500 stocks (black/gray) remain within 20% of their 52-week highs. The other 60% are in what some would refer to as a bear market.

Not surprisingly, the larger stocks in general are holding up better than the smaller stocks.

In somewhat surprising news the cheapest stocks, at least sorted by P/E, are getting hit the hardest.

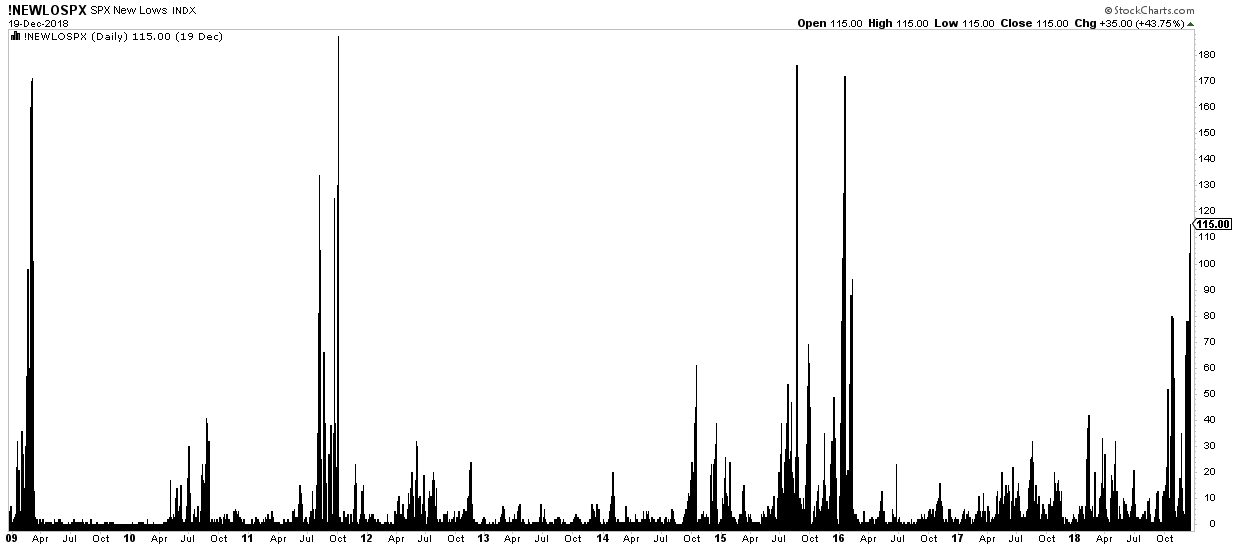
Sticking with the S&P 500, the number of new lows has spiked, which happened near previous bottoms (Feb 2016, Aug 2015, Oct 2011).

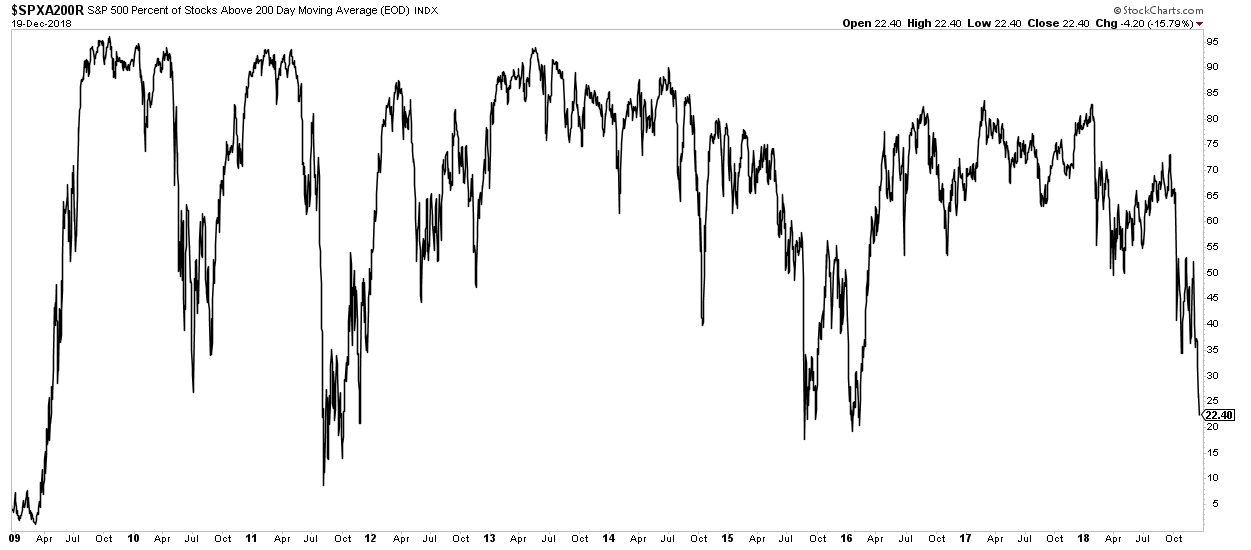
The washout in percent of stocks above the 200-day shows a similar picture.

The good news is that a lot of damage has already been done.  The bad news is nobody knows how much more damage is still to come.

This content, which contains security-related opinions and/or information, is provided for informational purposes only and should not be relied upon in any manner as professional advice, or an endorsement of any practices, products or services. There can be no guarantees or assurances that the views expressed here will be applicable for any particular facts or circumstances, and should not be relied upon in any manner. You should consult your own advisers as to legal, business, tax, and other related matters concerning any investment.

The commentary in this “post” (including any related blog, podcasts, videos, and social media) reflects the personal opinions, viewpoints, and analyses of the Ritholtz Wealth Management employees providing such comments, and should not be regarded the views of Ritholtz Wealth Management LLC. or its respective affiliates or as a description of advisory services provided by Ritholtz Wealth Management or performance returns of any Ritholtz Wealth Management Investments client.

References to any securities or digital assets, or performance data, are for illustrative purposes only and do not constitute an investment recommendation or offer to provide investment advisory services. Charts and graphs provided within are for informational purposes solely and should not be relied upon when making any investment decision. Past performance is not indicative of future results. The content speaks only as of the date indicated. Any projections, estimates, forecasts, targets, prospects, and/or opinions expressed in these materials are subject to change without notice and may differ or be contrary to opinions expressed by others.

The Compound Media, Inc., an affiliate of Ritholtz Wealth Management, receives payment from various entities for advertisements in affiliated podcasts, blogs and emails. Inclusion of such advertisements does not constitute or imply endorsement, sponsorship or recommendation thereof, or any affiliation therewith, by the Content Creator or by Ritholtz Wealth Management or any of its employees. Investments in securities involve the risk of loss. For additional advertisement disclaimers see here: https://www.ritholtzwealth.com/advertising-disclaimers

Please see disclosures here.