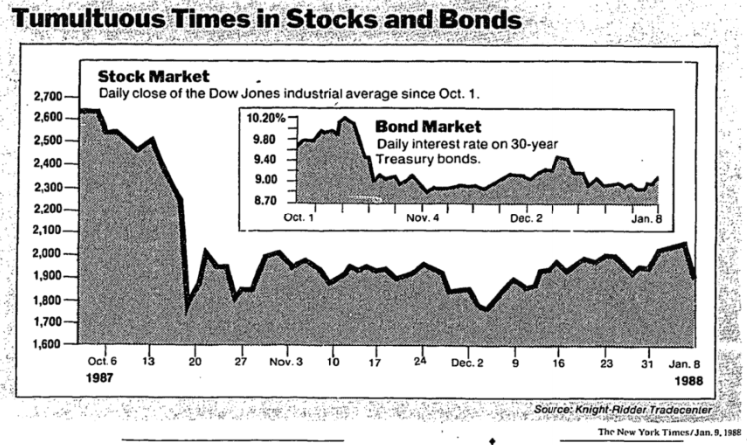
Take a look at the table below of the worst days for the stock market over the last ~50 years. You’ll see the usual suspects, Black Monday, the Asian currency crisis in 1997, the Russian crisis in 1998, and 5 days from the second half of 2008. Then there’s one that looks like it doesn’t belong, January 8, 1988.

January 8, 1988 was a Friday, which gave investors the weekend to wonder whether Monday would bring October 1987, redux. A trader spoke to the New York Times and asked:
“Is this the equivalent of Oct. 16” said Edward Collins, a vice president and trader at Daiwa Securities in New York, referring to the 108-point drop in the average on the Friday before the Oct. 19 market collapse. “Are we going to be down 500 points on Monday? i don’t think we’re into that. But they did some majoy damage today.”
This image from the cover of the paper did little to inspire confidence.
What caused the selling? There was little doubt.
“Whatever the cause of the steep drop in stock prices, there was little doubt on Wall Street that the rout was accelerated by computerized trading tied to the futures market in Chicago.”
But what caused the computers to sell? There were several factors, naturally.
More than a dozen analysts and traders, in telephone interviews, named several factors as possible causes for the plunge. These included rumors that the nation’s trade deficit had widened, reports that the budget deficit would be larger than expected and fears that the latest Government unemployment figures might signal higher inflation and interest rates. Even the snowstorm that blanketed the east Coast received some blame for the stock market’s fall. The storm apparently led many big traders to go home early, robbing the market of its ability to match buyers with sellers.
As is always the case, there were reason to be concerned that 1988 was not going to be kind for stocks.
- The S&P 500 was coming off six consecutive years of gains totaling 160%, or 17.3% annualized.
- In 1987, the price-to-earnings ratio of the S& 500 climbed above 20 for the first time since the early 1960s.
- Stanley Druckenmiller, in an interview with Barron’s (h/t NeckarValue), said “We look at the market in three different ways- and each of them is flashing warning signals.” He told Fortune, “We see an economy that’s in a lot of trouble…What would make us more bullish would be the recognition that we are in a recession.”
Whatever fears were in the air in 1988 did not manifest themselves in the stock market. The S&P 500 rose 12.4%, 16.8% including dividends

Whenever stocks experience a large decline, it’s normal to look for someone or something to blame; The Fed, China, inflation, computers, etc. We can never determine exactly why stocks do what they do, especially when we’re searching for answers on a daily basis, and in the age of click bait and sensationalism, it’s unlikely that we’ll ever read an honest news update.

