If you missed just the 25 strongest days in the stock market since 1990, you might as well have been in five year treasury notes.
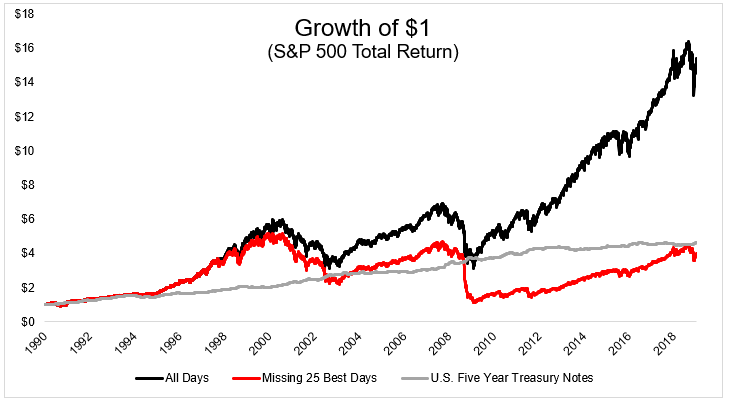
This remarkable data point is almost always followed by “time in the market beats timing the market.” I’m generally on board with this line of thinking, however, I don’t necessarily agree that this chart is the best way to prove this point.
If by some miracle you managed to miss the 25 best days, you likely would have missed at least some of the worst days as well. The chart below shows the rolling 30-day standard deviation of the S&P 500 with the 25 best days (green dots) and 25 worst days (red dots).
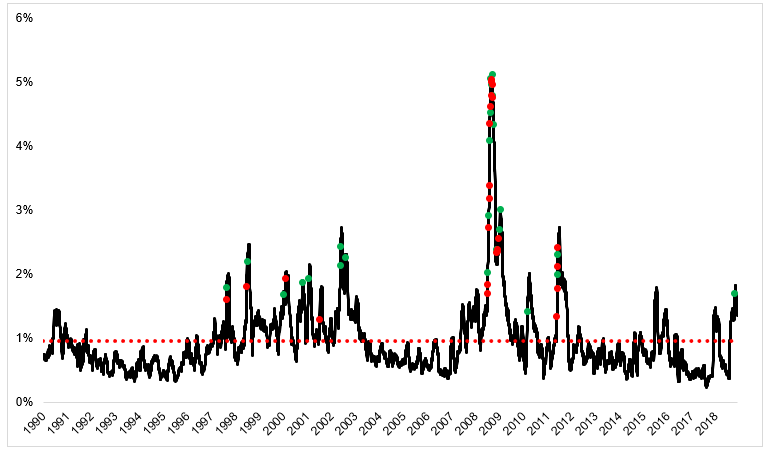
You’ll notice a few things. The best days often follow the worst days, and the worst days occur in periods of above average volatility (red dotted line). These volatility spikes happen in lousy markets, so, if you can avoid the very best days, you will probably also avoid the very worst days, thereby avoiding lousy markets.
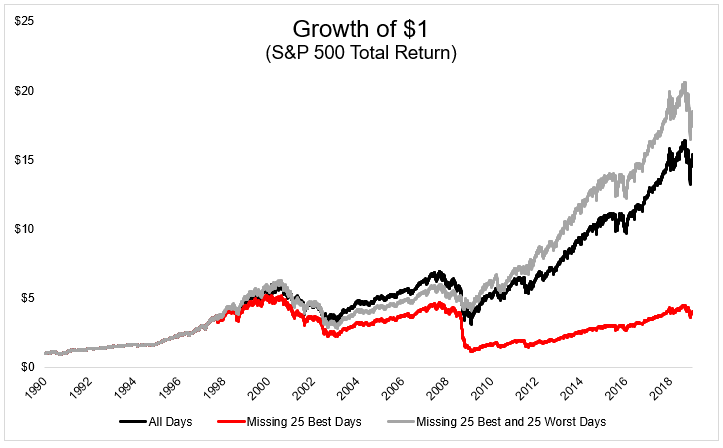
The chart below shows what happens if you were able to successfully avoid the 25 best and 25 worst days. This would have put you well ahead of the index. Of course this assumes perfect end of day execution, no transaction costs, and most importantly, no taxes.
This is all well and good but where does somebody get this crystal ball? You don’t need one. Going back to 1997, 46 of the 50 best and worst days occurred below the 200-day moving average.
Let’s take a look at how one could have employed a strategy using this information.
The rules are simple: If the S&P 500 is above its 200-day, own it. If it closes below, shift to bonds (Barclay’s Agg). Again, it’s critical to point out that this assumes perfect execution, free trading and no taxes- none of which are actually available to us.
The chart of the S&P 500 below shows how this plays out. The black dotted line is the 200-day, gray is when you would have been invested in stocks, and red is when you would have been invested in bonds.
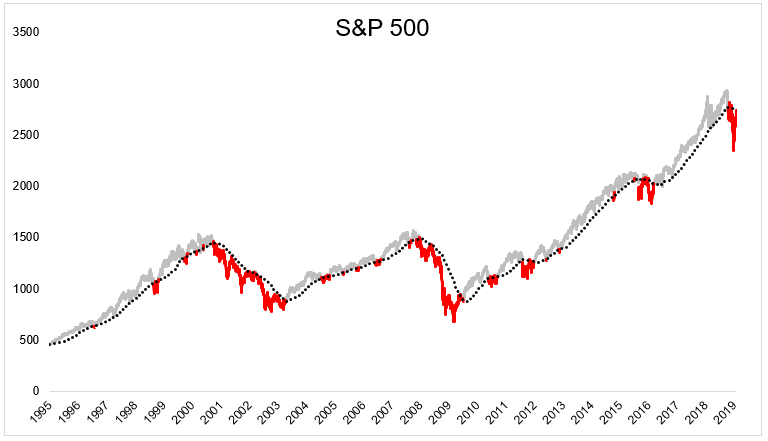
This simple strategy came out ahead of buy and hold. You might be wondering what is the significance of 1997 as a starting date? Nothing, other than this is when daily data is available for S&P 500 total return index and Bloomberg Barclay’s Aggregate Bond Index(Data from YCharts).
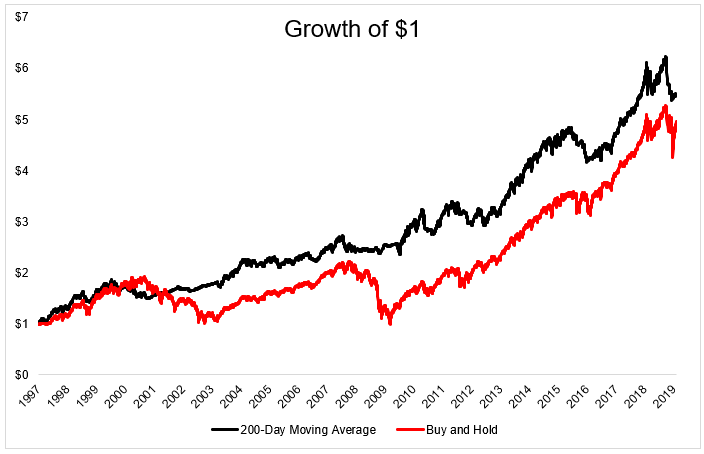
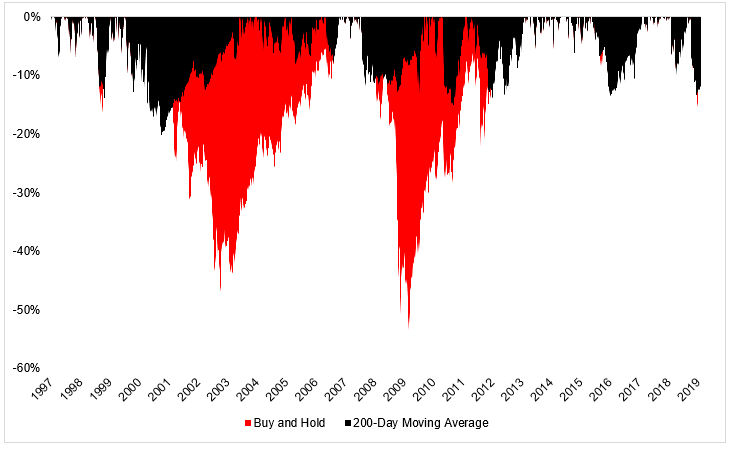
The fact that it outpaced the index is great, but what’s even better is that it was able to accomplish this with significantly lower drawdowns.
There’s gotta be a catch right? Right. Sort of.
As I already mentioned two times, this assumes no taxes, no transaction costs, and perfect end of day execution. I haven’t yet mentioned the most important assumption, which is that you could stick with this for twenty years.
This model would have given around 160 signals since 1997- would you have taken all of them? Would you have been able to trust the model and ignore your intuition? Would you have been able to trust the model when it provides 10 signals in 30 sessions? Would you have been able to stick with it when it is dramatically underperforming the index?
The chart below plots the difference between this strategy and the index over 90 day periods. As you can plainly see, there are plenty of times where this lags by a wide margin.
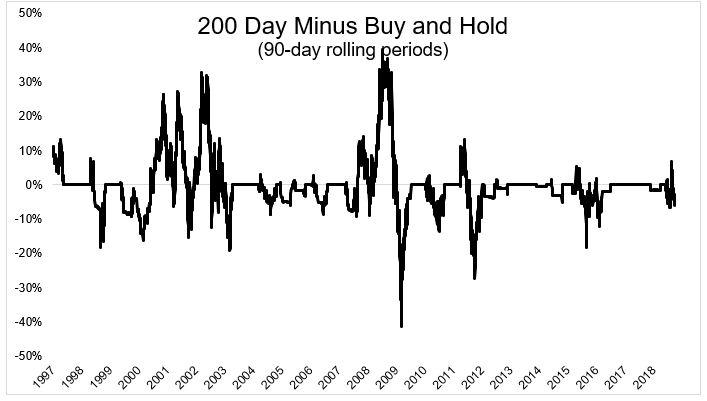
The underperformance typically happens when the 200-day strategy is in bonds and stocks are experiencing a rebound. For example, this didn’t get back into the market until June 1, 2009, when stocks were already 41% off their lows. Now granted, you theoretically would have missed most of the decline, so not buying at the bottom is not a big deal. At least it doesn’t feel like a big deal when you’re looking at a back-test.
Trend following is a deep rabbit hole and I want to make clear that the 200-day moving average is not a magical line. I don’t see any reason why it is better than the 175 or 215 or whatever. Here are a few things I think regarding this type of strategy:
- It’s reasonable to build a model that uses naive diversification, say 10% in 10 different signals.
- It’s reasonable to employ this strategy but put bands around the moving average to decrease trading.
- It’s reasonable to buy only when the moving average is trending higher and sell only when it’s trending lower.
- It’s reasonable to decide you don’t want to use this type of strategy at all.
Investing is all about tradeoffs and it’s the investor’s job to find the ones they’re willing to make.
When looking at things like this, it’s important to keep in mind that back tests are easy, the real world is hard.

