Over the last two days, small cap value stocks gained 7.4%. Over the same time, large tech stocks fell 1%. The spread between these two slices of the market has widened to levels last seen during the implosion of the dotcom bubble.
Small cap value investors aren’t cheering just yet, as this bounce comes after an absolute thrashing. While the S&P 500 fell nearly 35% peak-to-trough, small value fell nearly 45%.
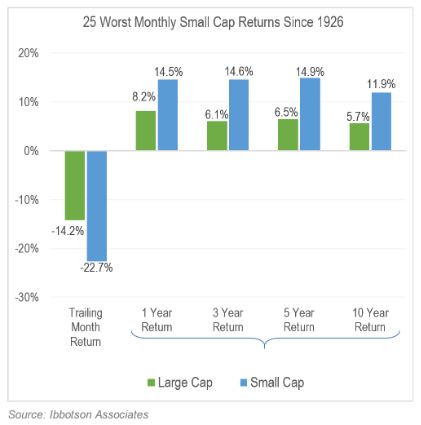
The underperformance of small relative to large during this decline is consistent with history, as you can see in the chart below, courtesy of O’Shaughnessy Asset Management.
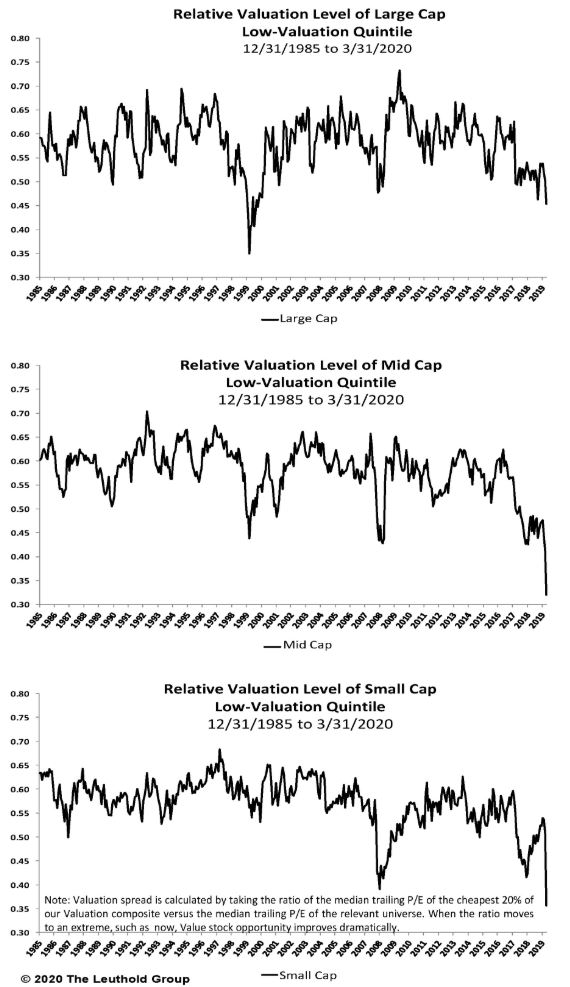
Cheap stocks had been reaching “sin a little” territory prior to 2020, but the recent environment has sent them to historical levels, particularly in the small cap space. The Leuthold Group shared this chart which shows how cheap value stocks have gotten relative to the rest of the market, sorted by size.
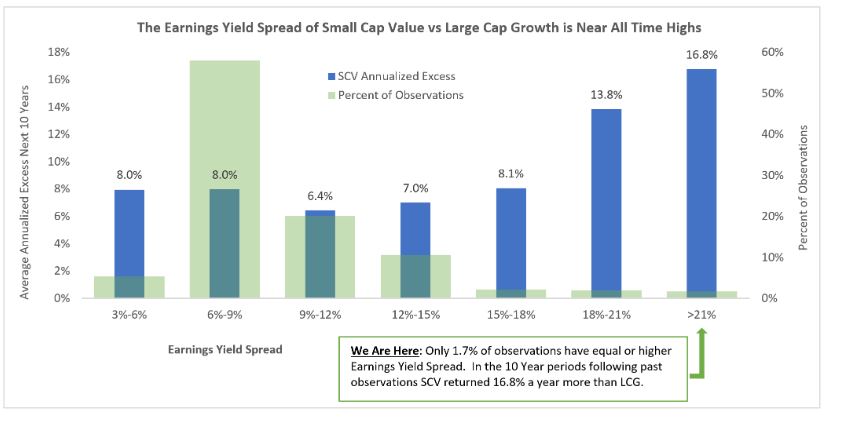
The extreme levels that we’re currently seeing have historically been great for small cap value going forward. Jamie Catherwood and Travis Fairchild at OSAM write:
When comparing the earnings yield of the cheapest small stocks (cheapest decile by price-to-earnings) to the most expensive decile of large cap stocks in the US we see a spread of more than 21%. Following extreme periods like this historically, small value outperformed large growth by 16.8% annualized over the following 10 years.
It’s silly to draw conclusions based on two days of returns, but given how much large growth has outperformed small value, and given the strength of this bounce, it could be the start of something bigger.
Michael Batnick is a managing partner at Ritholtz Wealth Management. He is the co-host of Animal Spirits, What Are Your Thoughts, and The Compound and Friends. For disclosure information please see here.
Get a Full Investor Curriculum: Join The Book List
Every month you'll receive 3-4 book suggestions--chosen by hand from more than 1,000 books. You'll also receive an extensive curriculum (books, articles, papers, videos) in PDF form right away.