Nvidia is one of the most expensive stocks in the S&P 500.

Nvidia is not the first giant tech company to trade at a rich valuation. The one that people often compare it to is Cisco, one of the darlings from the dot com era. We can’t compare things to the future, so we look to the past.
Cisco sported an $8.9 billion market cap on the opening day of 1995. At its peak just over five years later, it was $556 billion. The 4,000% increase over a five-plus year period was remarkably smooth considering the insane increase. These sorts of gains are oftentimes a bucking bronco, making it almost impossible to hold on.
The deepest drawdown from the beginning of 1995 to the top in March 2000 was 38%, and investors were made whole just 49 days after the bottom. The average distance from an all-time high over this period was just 6%. Truly incredible for a stock that compounded at 101% a year over that time.
Nvidia investors have earned 660% over the last five-plus years. While still excellent, it’s nowhere near the 4,000% return Cisco delivered on its way to the top. In addition, Nvidia investors have had a much rockier ride, seeing two crashes of more than 55%. The average distance from an all-time high over this time for Nvidia was -23%. If you hung on, you deserve every penny.
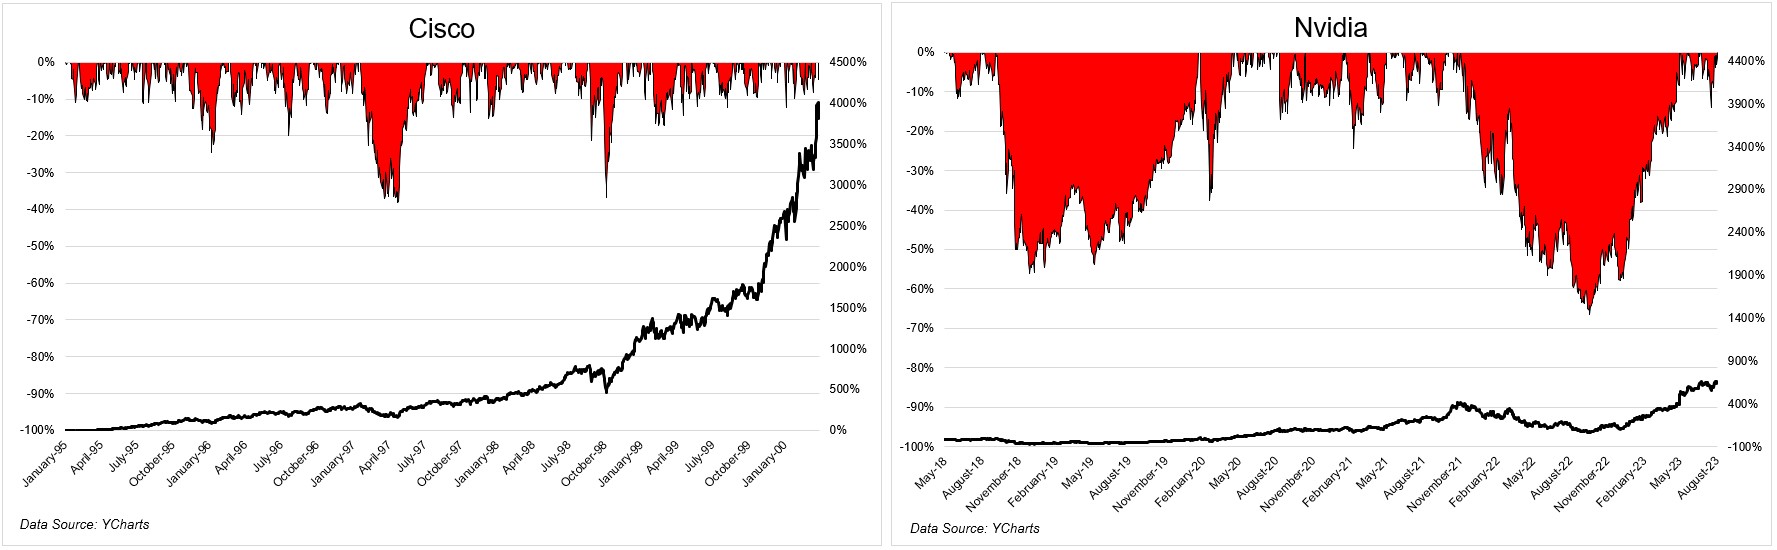
For investors who were late to the dotcom party, the other side of this ride was gut-wrenching. From its peak in March 2000 to the bottom in September 2001, Cisco lost 86% of its value. Even today, more than 20 years later, the stock is still 30% below its highs.*
I’ve seen data saying that Cisco has grown its top line at 20% a year since its peak in 2000. The point being that businesses can have magnificent growth, but investors can have a different experience if they dramatically overpay for that growth.
At 39 times sales in 2000, clearly Cisco investors were paying up for future growth. The problem is that the 20% number I’ve seen didn’t materialize. From 2001 through 2022, Cisco grew its top line at 4.5% a year. With the benefit of hindsight, that was hardly worth paying through the nose for. Its revenue was less in ’01 than it was in ’00, less in ’02 than it was in ’01, and less in ’03 than it was in ’02.
 So, how does today’s premier growth stock compare to Cisco? If you adjust for inflation, the revenue that Cisco generated in 2000 is similar to where Nvidia is today. Over the trailing twelve months, Nvidia is a bit behind where Cisco was in 2000, but if you include estimates for the next quarter, we’re looking at $40 billion in revenue for 2023. The P/S ratio is in line, but the big difference is profitability and growth. Investors are paying 113 times TTM earnings, but just ~43 times next year’s estimates.

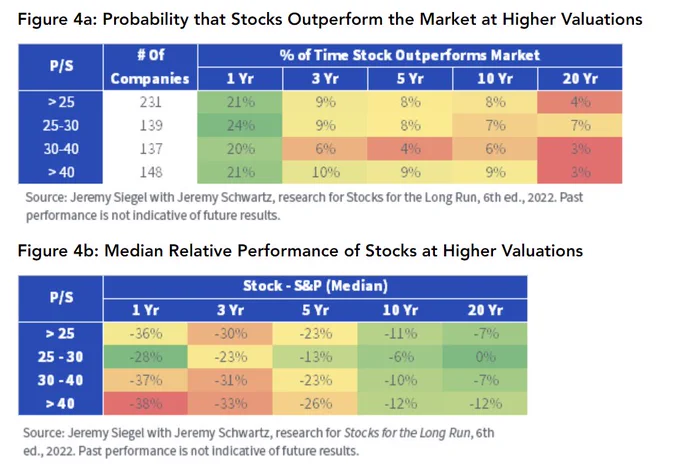
The trillion-dollar question is, how much are investors paying for Nvidia’s bright future, and what does history say about companies trading at lofty valuations?
231 companies have reached a similar multiple over the last 50+ years, according to Jeremy Schwartz. Only 20% of stocks trading with a P/S ratio between 30-40 outperformed the market over the next 12 months. The more you extend your time horizon, the worse the results get. Over a 10-year period, that number drops down to 6%.
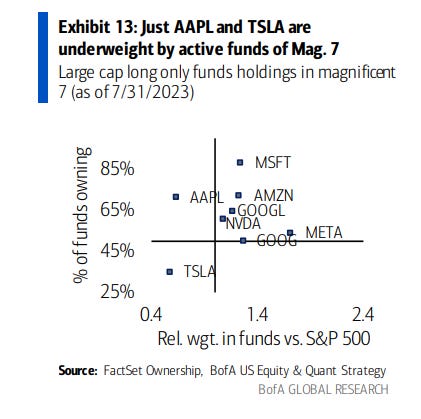
While Cisco versus Nvidia might be a fun thought exercise, we have to understand the differences between where the former was in 2000 and where the latter is today. In 2000, the dot com bubble had been running hot for more than five years. As a result, nearly everyone was all-in, or at least in on the tech trade. The AI era only began a couple of months ago. While there are no underperform or sell recommendations on Nvidia, active managers are more overweight Google, Amazon, Microsoft, and Meta.
It makes sense that Nvidia is trading rich, considering its recent earnings revisions and the insatiable demand for its GPUs. Adam Parker said, “Over the last six months, the consensus expectations for calendar 2024 (NVDA’s CY 2024 closes in Jan ’25) revenue has risen from roughly $35 billion to $75 billion, the result of their May earnings–which yielded the largest upward sales revisions of any mega cap company ever.”
If Nvidia delivers more than what’s priced into the stock, it will continue to work. If it doesn’t, it’s going to get smashed. Everyone knows this. What nobody knows is whether it will or it won’t.
It’s helpful to look at base rates like Jeremy Schwartz did, but you’re not going to make money if you’re comparing a stock of this era to a stock from a previous one and think that the story will mirror one another. It’s a mental shortcut, and that’s usually not rewarded. If I’m writing a post asking if Nvidia is the next Cisco, the answer is probably no.
Josh and I are going to cover Nvidia and much more on tonight’s What Are Your Thoughts?
*On a total return basis, the stock got back to new highs in August 2021.

