Seasonal Weakness

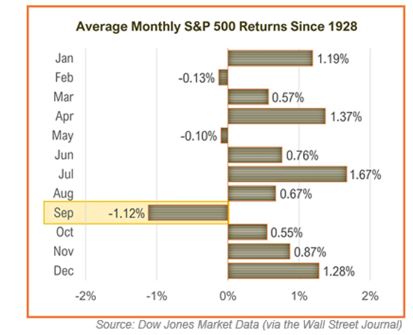
September has a long history of disappointing investors. Going back to 1928, it has by far delivered the worst monthly return for investors.

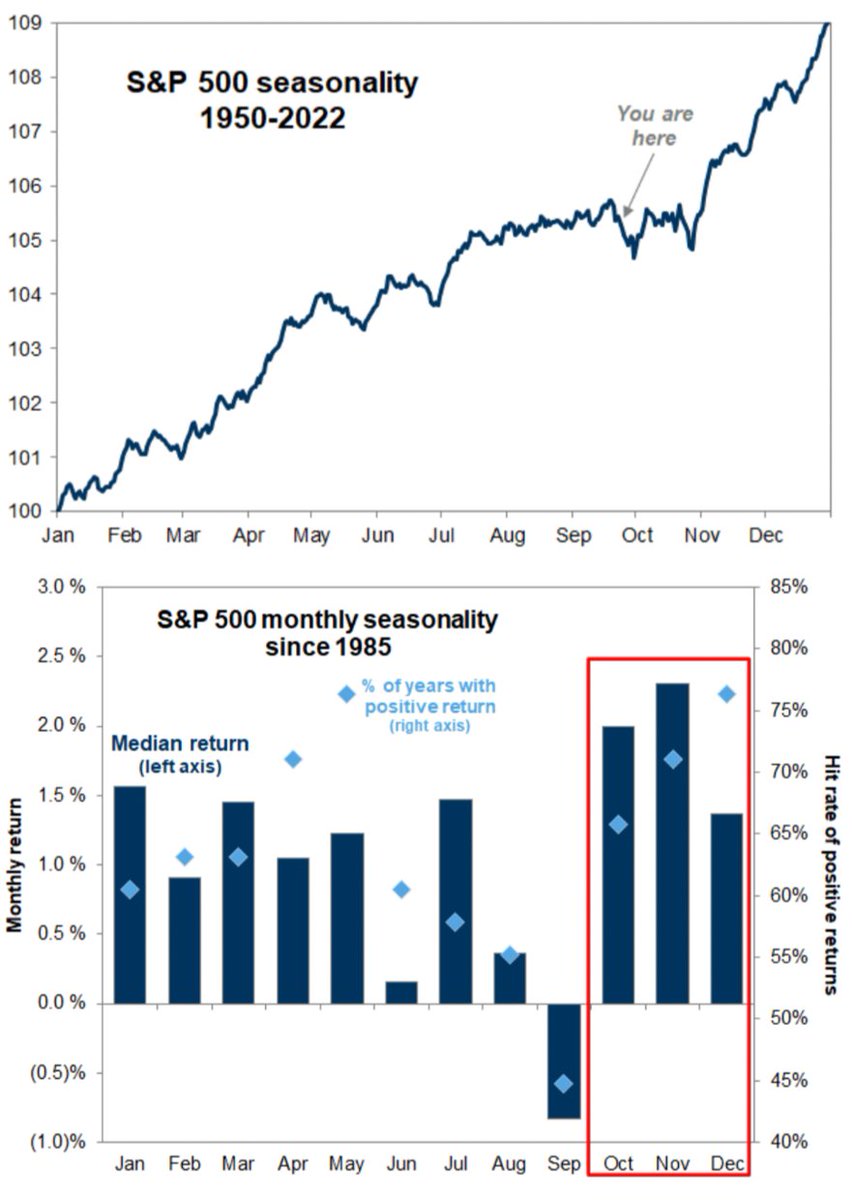
And true to form, it’s done so again, with the S&P 500 down nearly 6% on the month. As you can see from the chart below, seasonal weakness tends to occur in the back half of the month, and wouldn’t you know it, that’s what happened this time around. The S&P 500 was flat through the 14th. All of the losses have occurred over the last nine sessions.

I’m not sure why September is historically weak. Maybe it’s a fluke. Maybe it’s not. Sometimes the why doesn’t matter. What matters is how you respond to it.

I don’t change my investing strategy or allocation based on seasonals, but it can be helpful for your mindset. If you know that September is historically weak, again for reasons that aren’t important, then you can view the selloff through a clearer lens.

The good news is that we’re coming to the end of historical weakness.

Image

September has stunk for the last three years and now a fourth. The good news is that it did not spell doom for the fourth quarter, which gained 11.7%, 10.7%, and 7% in 2020, ’21, and ’22.

I wouldn’t sell my stocks before seasonal weakness or lever up in front of seasonal strength, but simply being aware of the seasonality of the market can help calm your nerves.


This content, which contains security-related opinions and/or information, is provided for informational purposes only and should not be relied upon in any manner as professional advice, or an endorsement of any practices, products or services. There can be no guarantees or assurances that the views expressed here will be applicable for any particular facts or circumstances, and should not be relied upon in any manner. You should consult your own advisers as to legal, business, tax, and other related matters concerning any investment.

The commentary in this “post” (including any related blog, podcasts, videos, and social media) reflects the personal opinions, viewpoints, and analyses of the Ritholtz Wealth Management employees providing such comments, and should not be regarded the views of Ritholtz Wealth Management LLC. or its respective affiliates or as a description of advisory services provided by Ritholtz Wealth Management or performance returns of any Ritholtz Wealth Management Investments client.

References to any securities or digital assets, or performance data, are for illustrative purposes only and do not constitute an investment recommendation or offer to provide investment advisory services. Charts and graphs provided within are for informational purposes solely and should not be relied upon when making any investment decision. Past performance is not indicative of future results. The content speaks only as of the date indicated. Any projections, estimates, forecasts, targets, prospects, and/or opinions expressed in these materials are subject to change without notice and may differ or be contrary to opinions expressed by others.

The Compound Media, Inc., an affiliate of Ritholtz Wealth Management, receives payment from various entities for advertisements in affiliated podcasts, blogs and emails. Inclusion of such advertisements does not constitute or imply endorsement, sponsorship or recommendation thereof, or any affiliation therewith, by the Content Creator or by Ritholtz Wealth Management or any of its employees. Investments in securities involve the risk of loss. For additional advertisement disclaimers see here: https://www.ritholtzwealth.com/advertising-disclaimers

Please see disclosures here.