The stock market is a complicated place.
You have all sorts of different participants: day traders and swing traders, high-frequency traders and market makers, stock pickers and asset allocators, growth investors and value investors, and on and on.
Then you have macroeconomic data that could impact the stock market in the short or long term: manufacturing and service reports, jobless claims and total employment, headline and core inflation, both CPI and PCE. You have government spending and deficits and surpluses. You have the fed funds rate and the thirty-year interest rate and everything in between. There are housing starts and existing home sales, and on and on it goes.
Finally, you have the companies that make up the stock market. Small caps and mega caps. New issues and incumbents. Then you have all the sectors from industrials to financials, and all the industry groups from discount stores to specialty chemicals. Then you have what these businesses decide to do with their cash flows; R&D and cap-ex, dividends and buybacks.
Yep. The stock market is a complicated place.
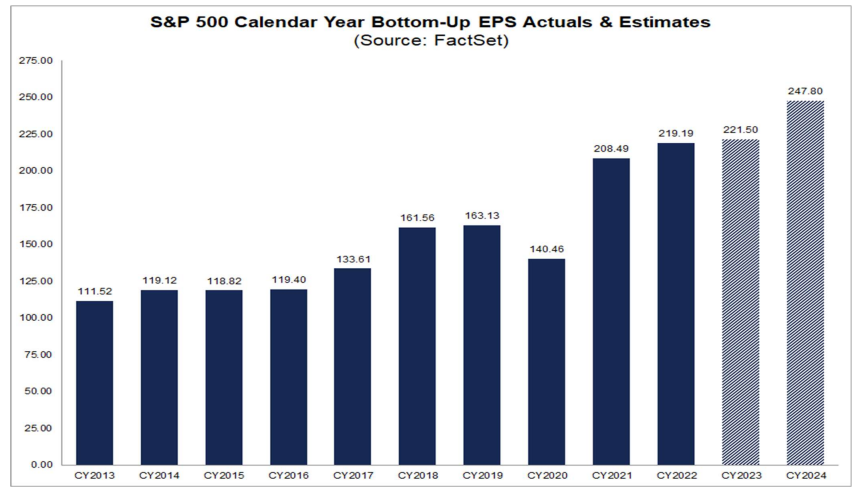
The value of all of these companies are based on earnings. But even that isn’t really the whole story. Are earnings rising or falling? Are companies guiding higher or lower? Does the market believe said earnings are sustainable, or will they come under pressure? And who determines what earnings are worth? And where do earnings estimates come from? Okay, that last one is pretty straightforward; they come from analysts.
They estimate that S&P 500 earnings are going to come in flat this year. And yet the S&P 500 is up 13% on the year, even after the recent selloff.
One other little detail about how to value the market is what are these earnings competing with? During the zirp era, the answer was “not much.” When money costs nothing, stocks are the only game in town. But when interest rates are offering an alternative, then at least theoretically, multiples of earnings should come down.
Double-digit fed funds rates in the 70s and early 80s, along with inflation, kept a lid on multiples.

While high interest rates tend to lead to lower multiples, that’s not always the case. The 1990s, which was one of the best decades for the stock market ever, had a Fed funds rate that averaged 5.15%, which is basically where we are today.
I’d have thought that interest rates going from 0 to 5% would put a serious dent in the stock market. But then again, the stock market is a complicated place. And maybe there is more to the story than looking at the stock market as a whole.
I showed last week that larger companies have weathered the storm much better since the Fed started raising rates. There are multiple reasons for this, like the fact that they are less reliant on fresh debt than smaller companies, just to name one.
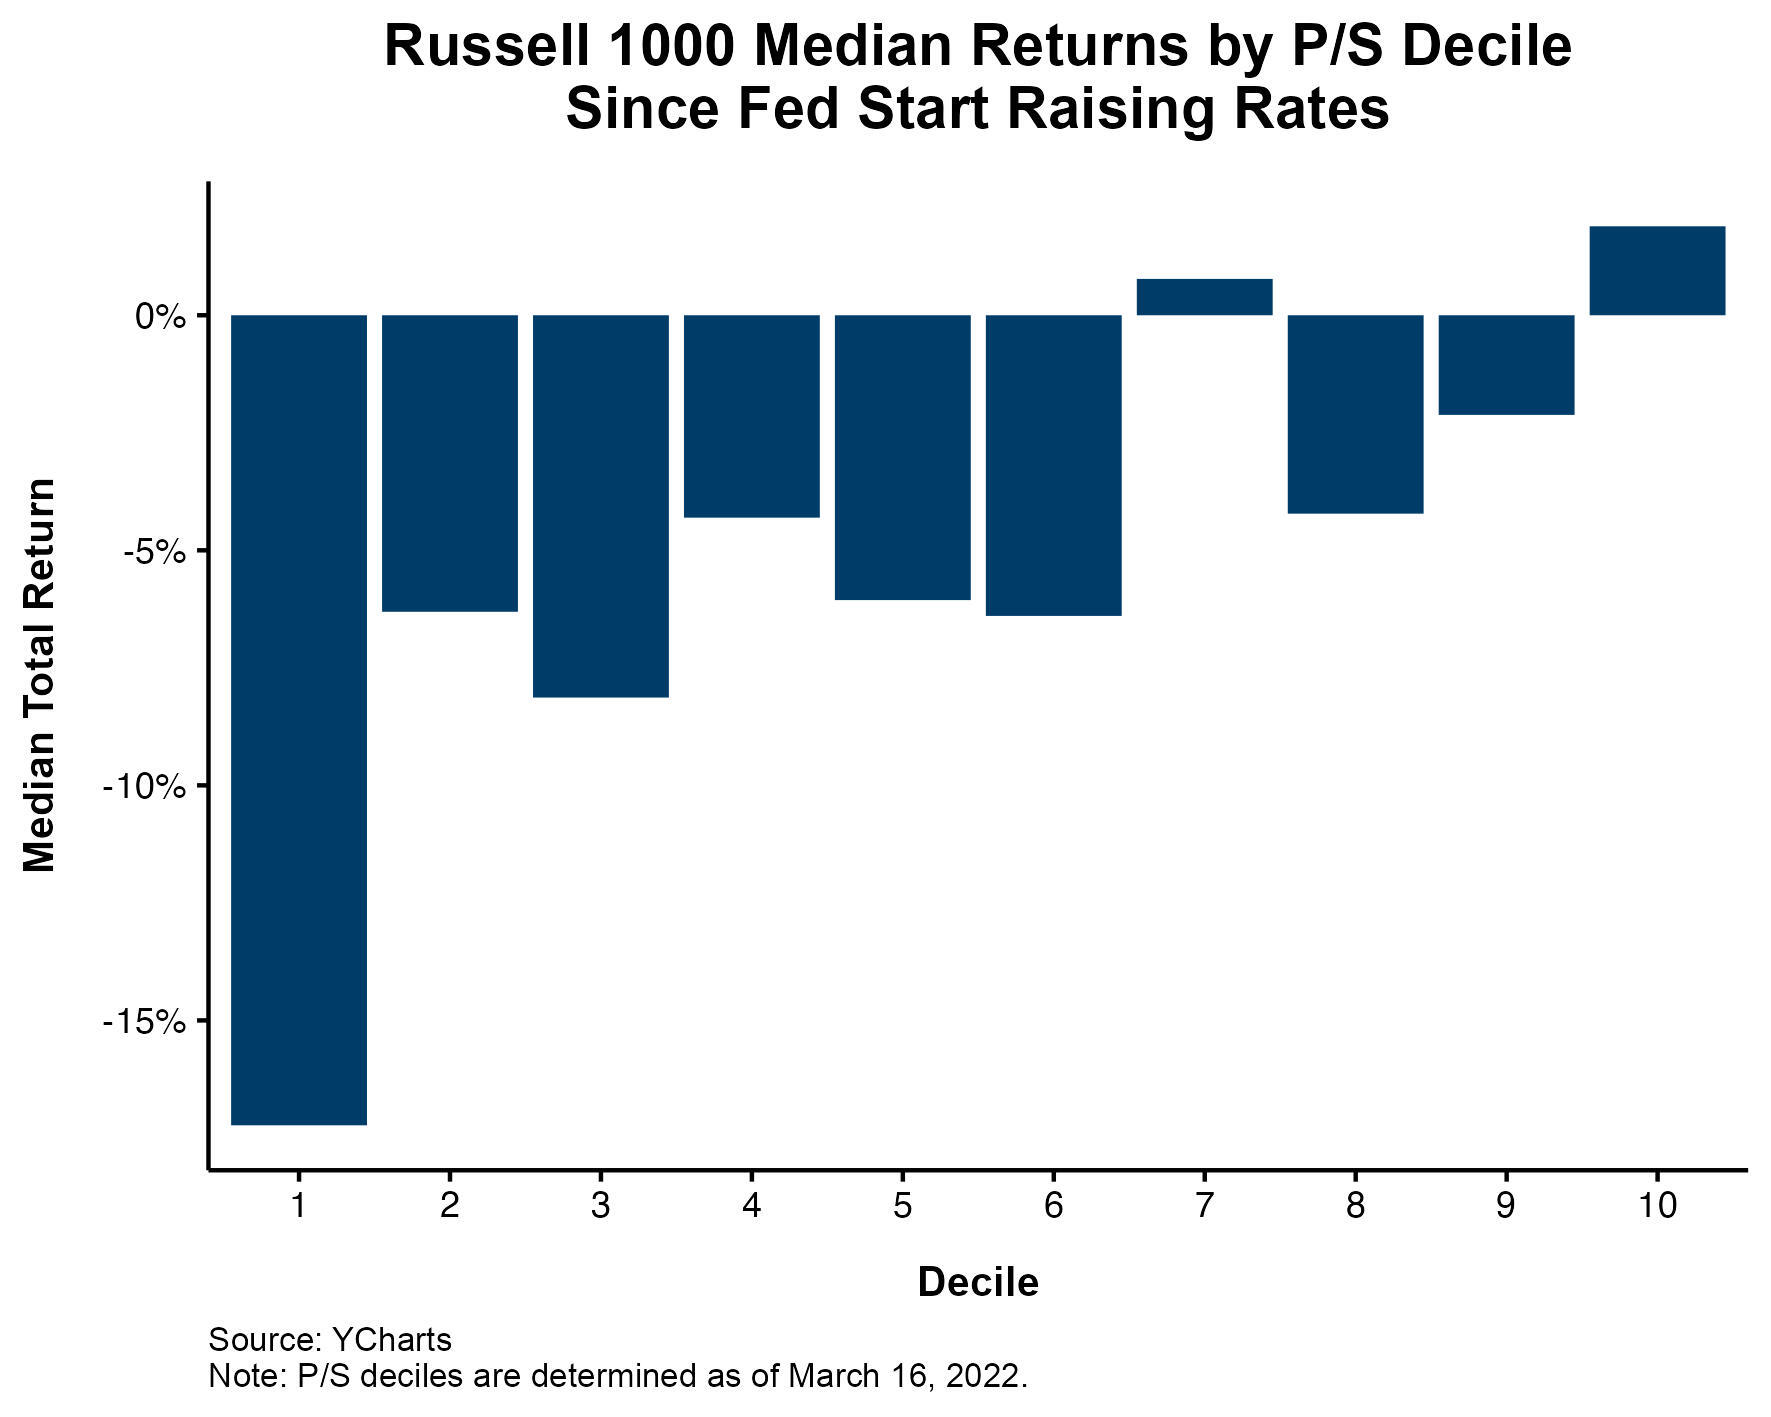
But if we sort the market a different way, we can see that interest rates have had a large impact at the company level. The chart below shows stocks sorted by their P/S ratio, with the highest (most expensive) in the first decile and the cheapest ones all the way on the right. Since the fed started raising rates, the median return is -17% for the most expensive bucket, while the cheapest bucket gained a couple of percent.
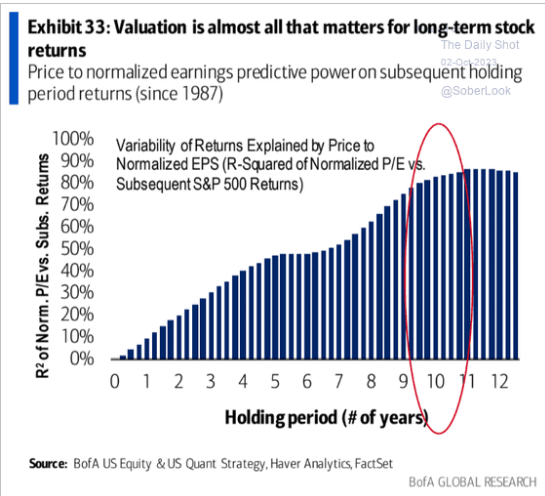
So, what’s the stock market worth? Unfortunately, it’s anybody’s guess over the short-term. Valuations don’t mean anything today, but they mean a whole lot in the future. Bob Elliott tweeted this chart and said, “Yield is destiny when it comes to investing…Recognizing that for long-term stock investors, pretty much all that matters is the earnings yield at initial purchase.
Even if we knew that analysts were right and the S&P 500 would earn $248 next year, how would you know what investors would pay for it? Fifteen times gets you to 3720, and twenty times gets you to 4960. Even if you knew earnings, and interest rates, and inflation, and employment, you still couldn’t confidently tell me where the stock market would be. Yep, the stock market is a complicated place.

