Cliff Asness is out with a new interesting paper, “Market Timing Is Back In The Hunt For Investors.” In it, he discusses the efficacy of using valuations, specifically the CAPE ratio, to help time the market. One thing Asness addresses is the valuation drift upward which U.S. stocks have experienced over the last century.
Here’s Cliff:
“As alluded to earlier when discussing the long-term upward drift in CAPE, another related but distinct headwind for contrarian stock market timing in the second half of our sample has been the decades-long valuation drift in post-World War II equity markets, over which the CAPE gradually doubled. The average CAPE for the decade immediately following WWII was 12.4, while the average CAPE since the year 2000 has been over 25.”
He then addresses the oft-heard argument that this valuation drift is a secular change.
“There’s always the additional risk that these secular changes are not just random wanderings, which will eventually work themselves out, but justified permanent changes in levels. That is, perhaps the CAPE is higher, but we should never expect it to go back to historical levels. This is a well-known ‘the world has changed’-type argument. While we tend to be natural cynics, as these arguments abound and are often wrong, they certainly can’t be dismissed.”
I do think there is some validity in the argument that stocks deserve a higher multiple today then they did at the turn of the 20th century. To understand why, let’s go back and look at America’s first billion dollar corporation, U.S. Steel. In 1902 they employed 168,000 people and had sales of $561 million. In today’s dollars, that’s ~$15.1 billion.
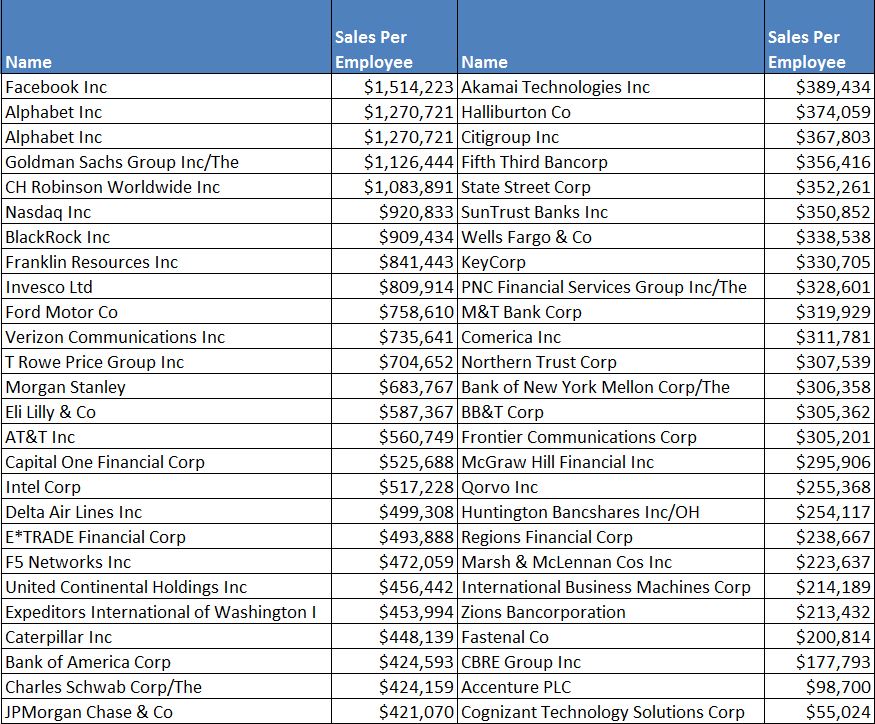
One of the reasons I believe we’ve seen an upward drift in valuations is because of the improvement in efficiency and productivity. Today, 175 S&P 500 companies have more revenue than $15.1 billion. In 1902, U.S. Steel had $3,340 in revenue per employee, which is $90,000 in 2014 dollars. Today, U.S. Steel’s revenue is $493,000 per employee, 5.5.x the amount it was in 1902.
Of the 52 S&P 500 companies that make this metric readily available, only one has sales per employee less than $90,000.
Not only has productivity vastly improved, but many of the frictions of trading have disappeared. Today, you can buy $100 million dollars worth of the S&P 500 with the push of a button and nobody would notice.
Along with improved productivity and trading execution, accounting standards have been a game changer. For much of the long-term CAPE averages, investors had little idea about a company’s actual financials. How much would you pay for $1 of suspected earnings when accounting laws didn’t exist?
With millions of Americans shoveling money into their retirement plans every month, there is a much greater demand for stocks than their was in the first half of the twentieth century. In roughly half of the long-term CAPE ratio, mutual funds, which brought stock investing into the main stream, didn’t even exist.
To be sure, I don’t think it’s impossible that we never see single digit valuations again, who could be so sure of such a thing. But getting back to the question of whether you can time the market based on valuation, I think that’s extraordinarily difficult. Consider that over the last 25 years and 925% return, stocks have been above their long-term CAPE average for 293 out of 309 months. While higher valuations absolutely do mean lower future returns, it’s all but impossible to know when to expect them.
When stocks look pricey, the best thing for most people to do is adjust their expectations accordingly. Making a habit of going in and out based on valuations is probably not going to help you build your wealth.

