When markets enter “correction territory” and volatility picks up, people are much more likely to tune into the TV or read a few articles. The financial media lives for these sorts of markets the same way The Weather Channel yearns for super storms. ” Their job is to sell advertisements, not make their audience better investors. Like my friend Phil Pearlman says, “the higher the Vix, the higher the clicks. With this in mind, take a look at the tweet I saw yesterday.
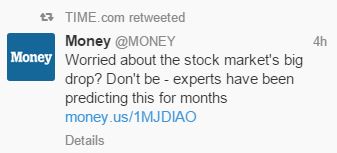
Let’s try and follow their logic here for a minute. While it’s true that on some metrics this is unprecedented volatility, you shouldn’t worry because…well because experts have been predicting this for months. Hmm, yea, I can’t either. I needed to find out more so I clicked on the link, which takes you to a video of Nobel Prize winning economist Bob Shiller, who says :
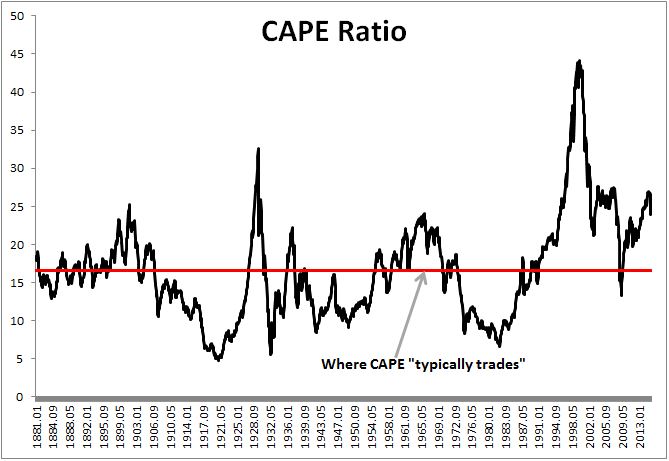
“We found that for the aggregate stock market, this CAPE ratio as we call it, is not terribly predictive, but somewhat predictive. You can’t really predict the stock market with much accuracy but when it’s high based on CAPE, it will probably not do as well and it’s high right now….For the United States if you look back over the past century, CAPE has typically been 15, 16, 18 something like that, even much lower than that, got down to 5 in 1921. It’s at 27 recently and so it’s very high by historical standards and that is a concern now.”
The interview ends with Shiller saying “we shouldn’t be too optimistic about the stock market.” RUN!
First I need to point out that Shiller is absolutely right on two of his points; 1) you can’t predict the stock market with much accuracy and 2) stocks do tend to have lower future returns when they are expensive. Here is where I have an issue and Shiller can take some of the heat for this; the viewer hears how expensive we are by historical standards and understandably so questions whether now is really a great time to be investing in “pricey” stocks. What with all the uncertainty in China, Iran and Greece, maybe it’s best to “wait for the dust to settle.”
When Shiller says 15-16 is where CAPE has typically been, what he really means is this is what the average has been. However, what he fails to mention is that over the past 25 years, the CAPE ratio has been above its historical average 95% of the time. Stocks have been below their historical average just 16 out of the last 309 months. Since that time, the total return on the S&P 500 is over 925%. You’ll notice in the chart below that valuations swing violently around the mean because they are a reflection of market psychology. You won’t see too many lines on the chart, other than the average, that move horizontally. Human emotions, and therefore valuations are typically swinging from one end of the pendulum to the other.
When I see things like this I think of Nick Murray who often says “That’s why god sent advisors.” Knowing the potentially hazardous content that’s out there makes me feel really good about the education we’re providing our clients. Long-term returns are greatly affected by your behavior, specifically how you act during bouts of volatility. If we can keep our clients in the markets, through good times and bad, we will greatly increase their chances of them hitting their goals, which is the only benchmark that truly matters.

