This is not a pretty picture. If this bleak projection were to come to fruition, a 60/40* portfolio would shrink $100 into $77 on a real basis over the next seven years.

As shown in the chart below, the -23% return that GMO is forecasting for a 60/40** portfolio is a rare occurrence, happening just 1.2% of the time going back to 1926. The two times investors received the flip side of reward over a 7-year period were from 1967-1974 and 1973-1980.
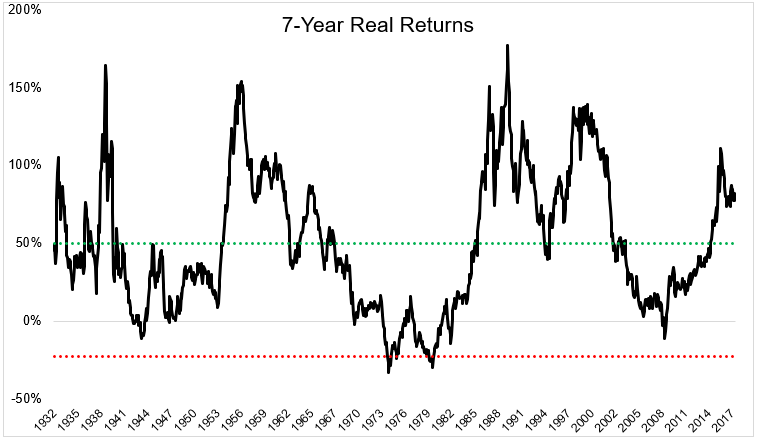
The average 7-year real return for a 60/40 portfolio is 50% (green line). But investors should take little comfort in historical averages because when the swings are this wide, the average is of little relevance. What this tells us is that historically, there was a 68% chance that over any 7-year period a 60/40 portfolio would return between 7 and 93%. Gee, that helps. The other thing is that even if the standard deviation were smaller, there’s no way to know if the average of the future will resemble the average of the past.
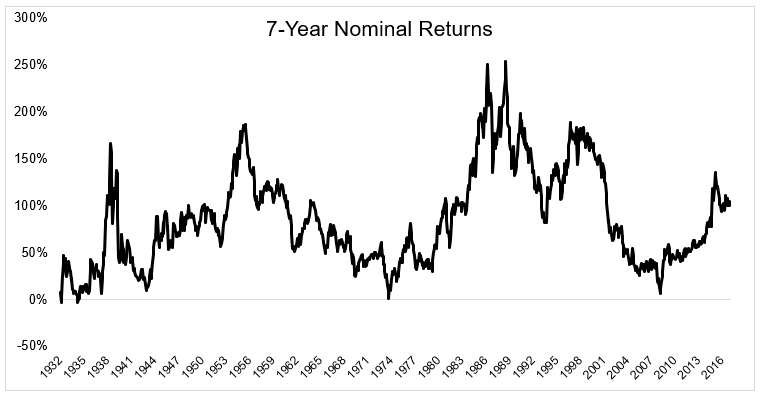
You can see from the chart below that the last time a 60/40 portfolio had a negative nominal 7-year return (before inflation, what you see on your account statements) was 1933.
At the end of the day, real returns are all that matter, but the way in which they’re packaged can trigger very different emotional responses. Investors can experience negative real returns in a number of different ways:
- Stocks fall and inflation takes a further bite out of your purchasing power. 1974 was the worst year ever in terms of real returns. The S&P 500 fell 26.5% and prices rose 12.3%. $100 invested in stocks in January 1974 was worth just $61 by the end of the year.
- 1931 was another devastating year. Stocks fell 43% and consumer prices were in a downward spiral, falling 10.3%. This dampened the real return, but the real life experience was the Great Depression.
- Then you can have inflation increasing faster than stock prices, which is what happened in 1970. Stocks gained 4%, but inflation rose by 5.6%.
If GMO is right and a 60/40 portfolio delivers a -23% return over the next 7 years, people are going to be hurting. The combination of inflation and losses people see on their accounts might affect how people behave, but at the end of the day, seventy-seven cents on the dollar after seven years would suck. It’s hard to prepare for a scenario that has only happened twice in the last ninety years. Let’s hope this forecast, like most others, does not come to pass.
Source:
*60% S&P 500, 40% Barclays Aggregate Bond Index. Annual rebalance.
** 60% S&P 500. 6% one-month T-Bills, 10% five-year T-notes. 12% long-term corporate bonds. 12% government bonds. Annual rebalance.

