In July, 24-40% of small businesses in major U.S. cities said they were in danger of closing.
By October, 1 in 5 businesses that were open in January had closed.
A global pandemic is hard on all businesses, but small ones have unique challenges that larger ones don’t.
From a cash-flow perspective, small businesses usually don’t have multiple revenue streams the way that some large companies do. From a financing perspective, they can’t raise money as quickly as larger companies can.
In the first nine months of last year, large public companies issued $1.9 trillion in debt. I don’t know what that number is for small businesses, but I would imagine it’s peanuts in comparison.
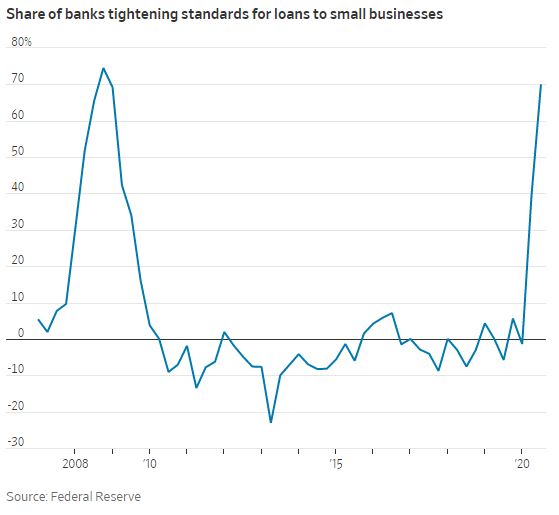
And when times are tough, small businesses can’t turn to banks. 70% of them reported tighter lending standards in the third quarter of 2020.
The chart shows what Mark Twain reportedly said: “A banker is a fellow who lends you his umbrella when the sun is shining, but wants it back the minute it begins to rain.”
And yet, and yet, you wouldn’t know that small businesses were on the ropes by looking at the stock market. Over the last year, the micro-cap index, representing the smallest publicly traded stocks, is outperforming the S&P 500 by three times.

So how do we square the narrative of “small businesses are on the ropes” with the fact that microcaps are up 55% over the last year and are at an all-time high?
Here are the three easiest (laziest) answers:
- The Fed. If it were not for the policies they enacted in concert with the Treasury, this chart would look much different.
- This ends badly. When the sugar high runs out, these stocks will come crashing back to earth.
- The stock market is not the economy.
I agree that absent monetary and fiscal stimulus, the charts would look way different.
I have no comment on “this ends badly.”
I think it’s more accurate to say that the stock market is not the economy today. The stock market is the economy in 6-12 months. At least I hope that’s what this chart is saying. Otherwise, shit, this really might end badly.
A simple explanation for this head-scratcher of a chart is that it probably isn’t the best reflection of small businesses in America. Nearly 30% of this index is made up of health care companies. Another 17% are financial institutions. It’s also worth pointing out that some of the YOLO-est stocks are in this index. But I’m not sure that holds up to scrutiny because many of those stocks crashed, and the index did not.
Whichever explanation you subscribe to, you gotta admit, this is one helluva chart.

