A week ago, stocks fell ~1% on news of President Biden’s tax proposal. Now a 1% decline isn’t newsworthy, but considering how quiet the market has been over the last few weeks, this was a rather noisy day.
And then for the lolz, on Friday the market erased all of the prior’s day declines and then some. I guess I shouldn’t be surprised. The returns on a single day tell you nothing about what will happen the next day.*
To verify this, I asked Nick Maggiulli to run some numbers. One of the charts he created shows how often 1% down days follow each other. The answer, not very often.
Another way to view the randomness of the market on a day-to-day basis is to look at the distribution of daily returns. These numbers look pretty similar for all days compared with days after a 1% gain or loss.
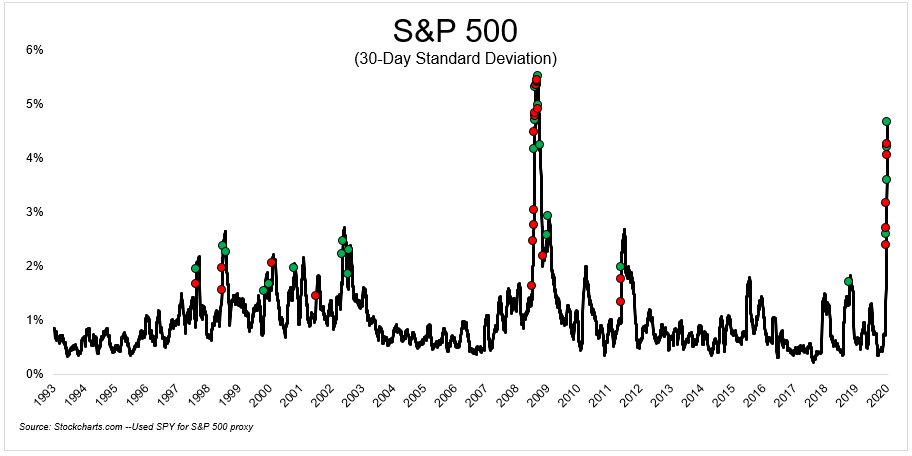
I’m not suggesting that markets follow a perfectly random walk. In fact, I would argue strongly against that. In the chart above, we can see those left tails are real. Really bad days tend to follow bad days. So do really good days. I’ve written about this concept before. The chart below plots the 25 best and 25 worst days going back to 1993 and you can see that they all occur during periods of above-average volatility.
Here’s some more data to negate the idea that stocks follow a perfectly random walk. The median return for all days going back to 1951 is 0.05%. The median return after a -1% day is 0.01%. The median return after a +1% day is 0.09%.
Alright, so maybe markets aren’t completely random, but for the sake of your portfolio, it’s best that you act like they are.
*What happened over the last X months certainly can influence what happens over the next X months. I’m a believer in momentum.
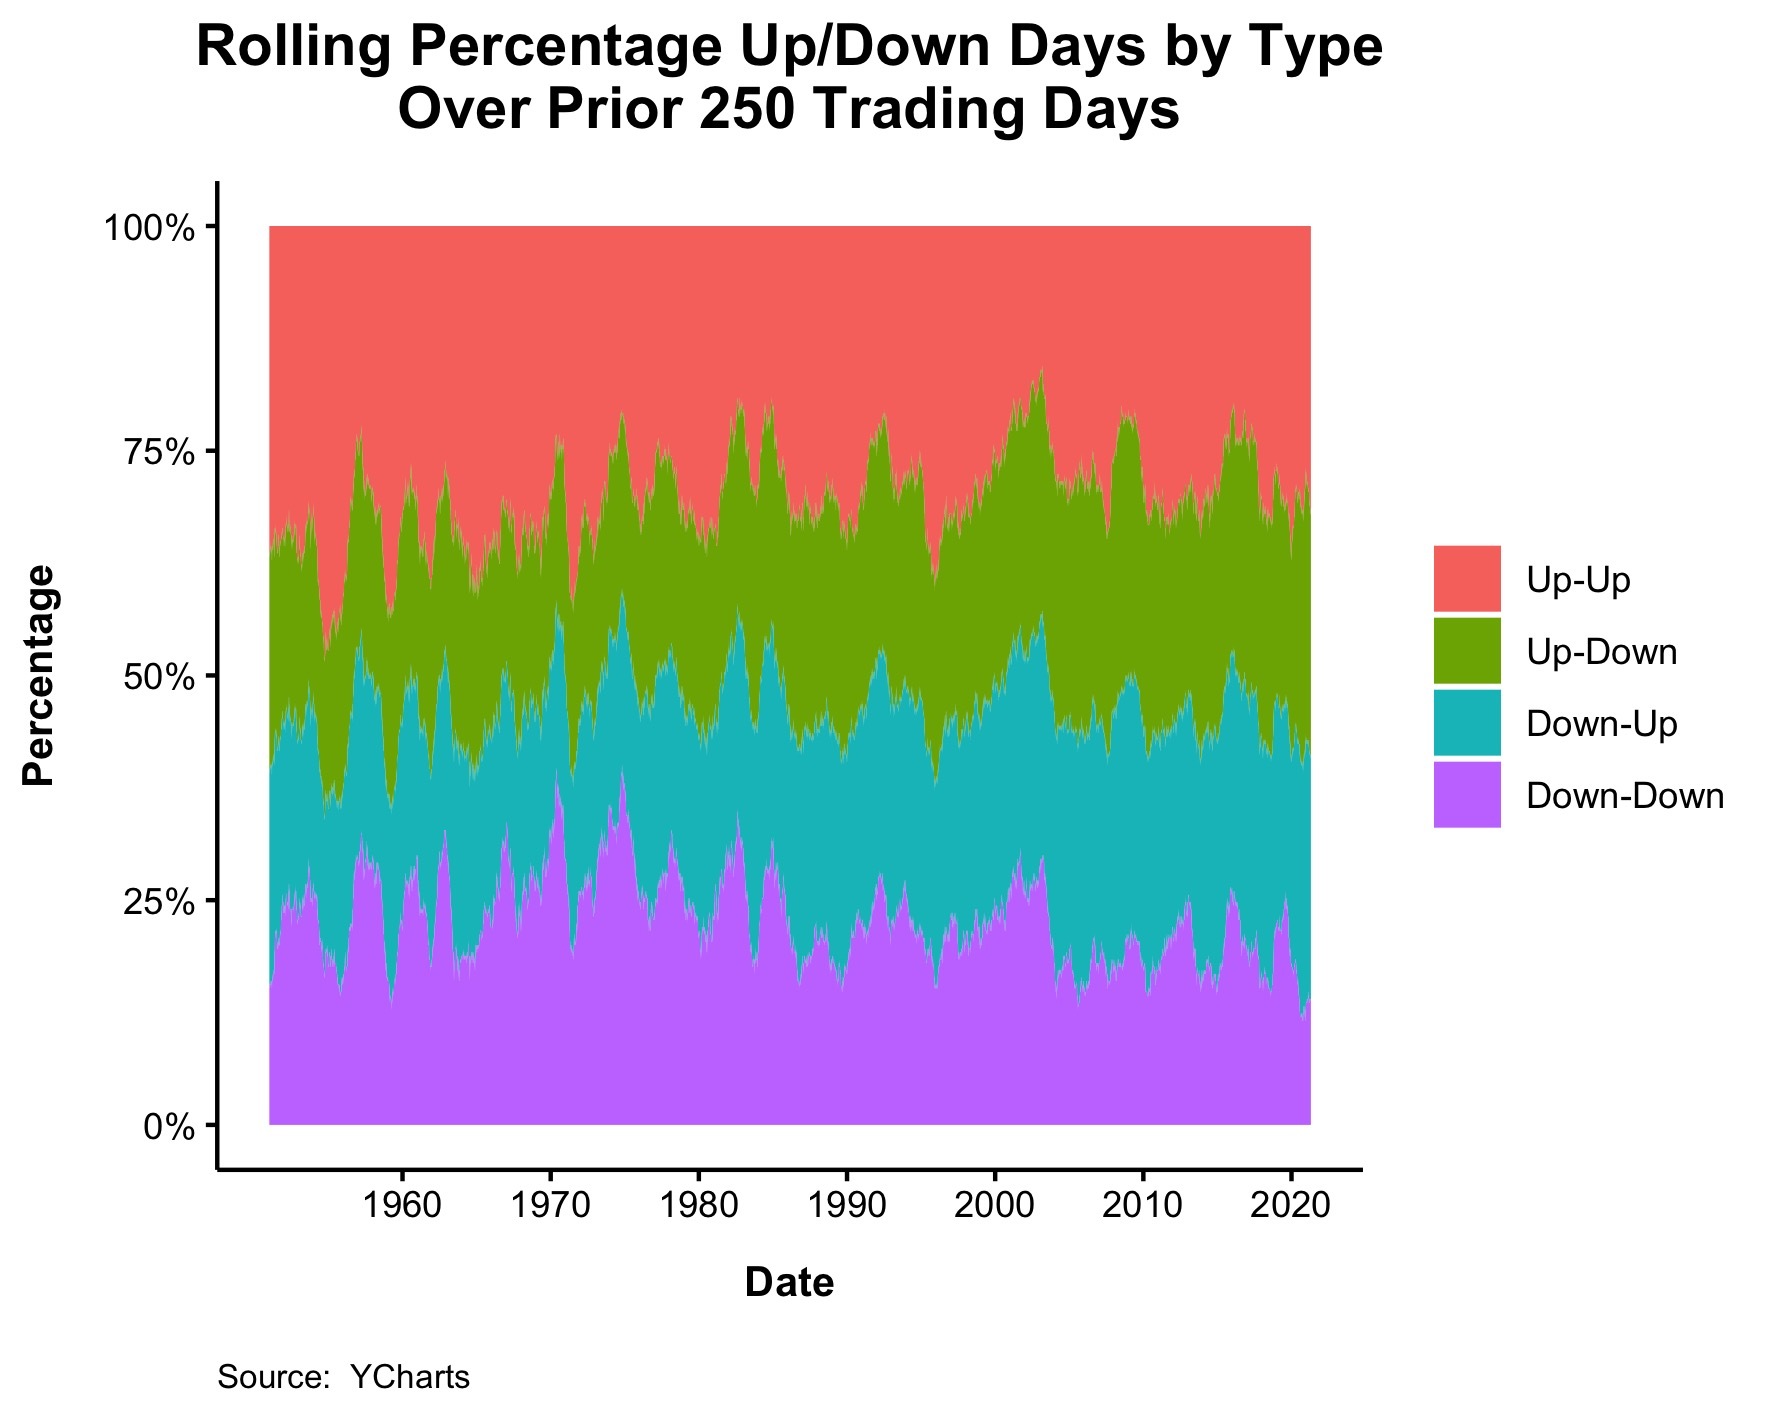
I’m not really sure what to do with this chart, but I just thought it was good eye candy.
Michael Batnick is a managing partner at Ritholtz Wealth Management. He is the co-host of Animal Spirits, What Are Your Thoughts, and The Compound and Friends. For disclosure information please see here.
Get a Full Investor Curriculum: Join The Book List
Every month you'll receive 3-4 book suggestions--chosen by hand from more than 1,000 books. You'll also receive an extensive curriculum (books, articles, papers, videos) in PDF form right away.