The S&P 500 is up 21% year-to-date. “Wait, what?” you might be thinking. Yep, it’s true. 21%. This number might not surprise index fund holders, but it’s likely to stun individual stock pickers. The S&P 500 is outperforming 73% of the stock in the index!
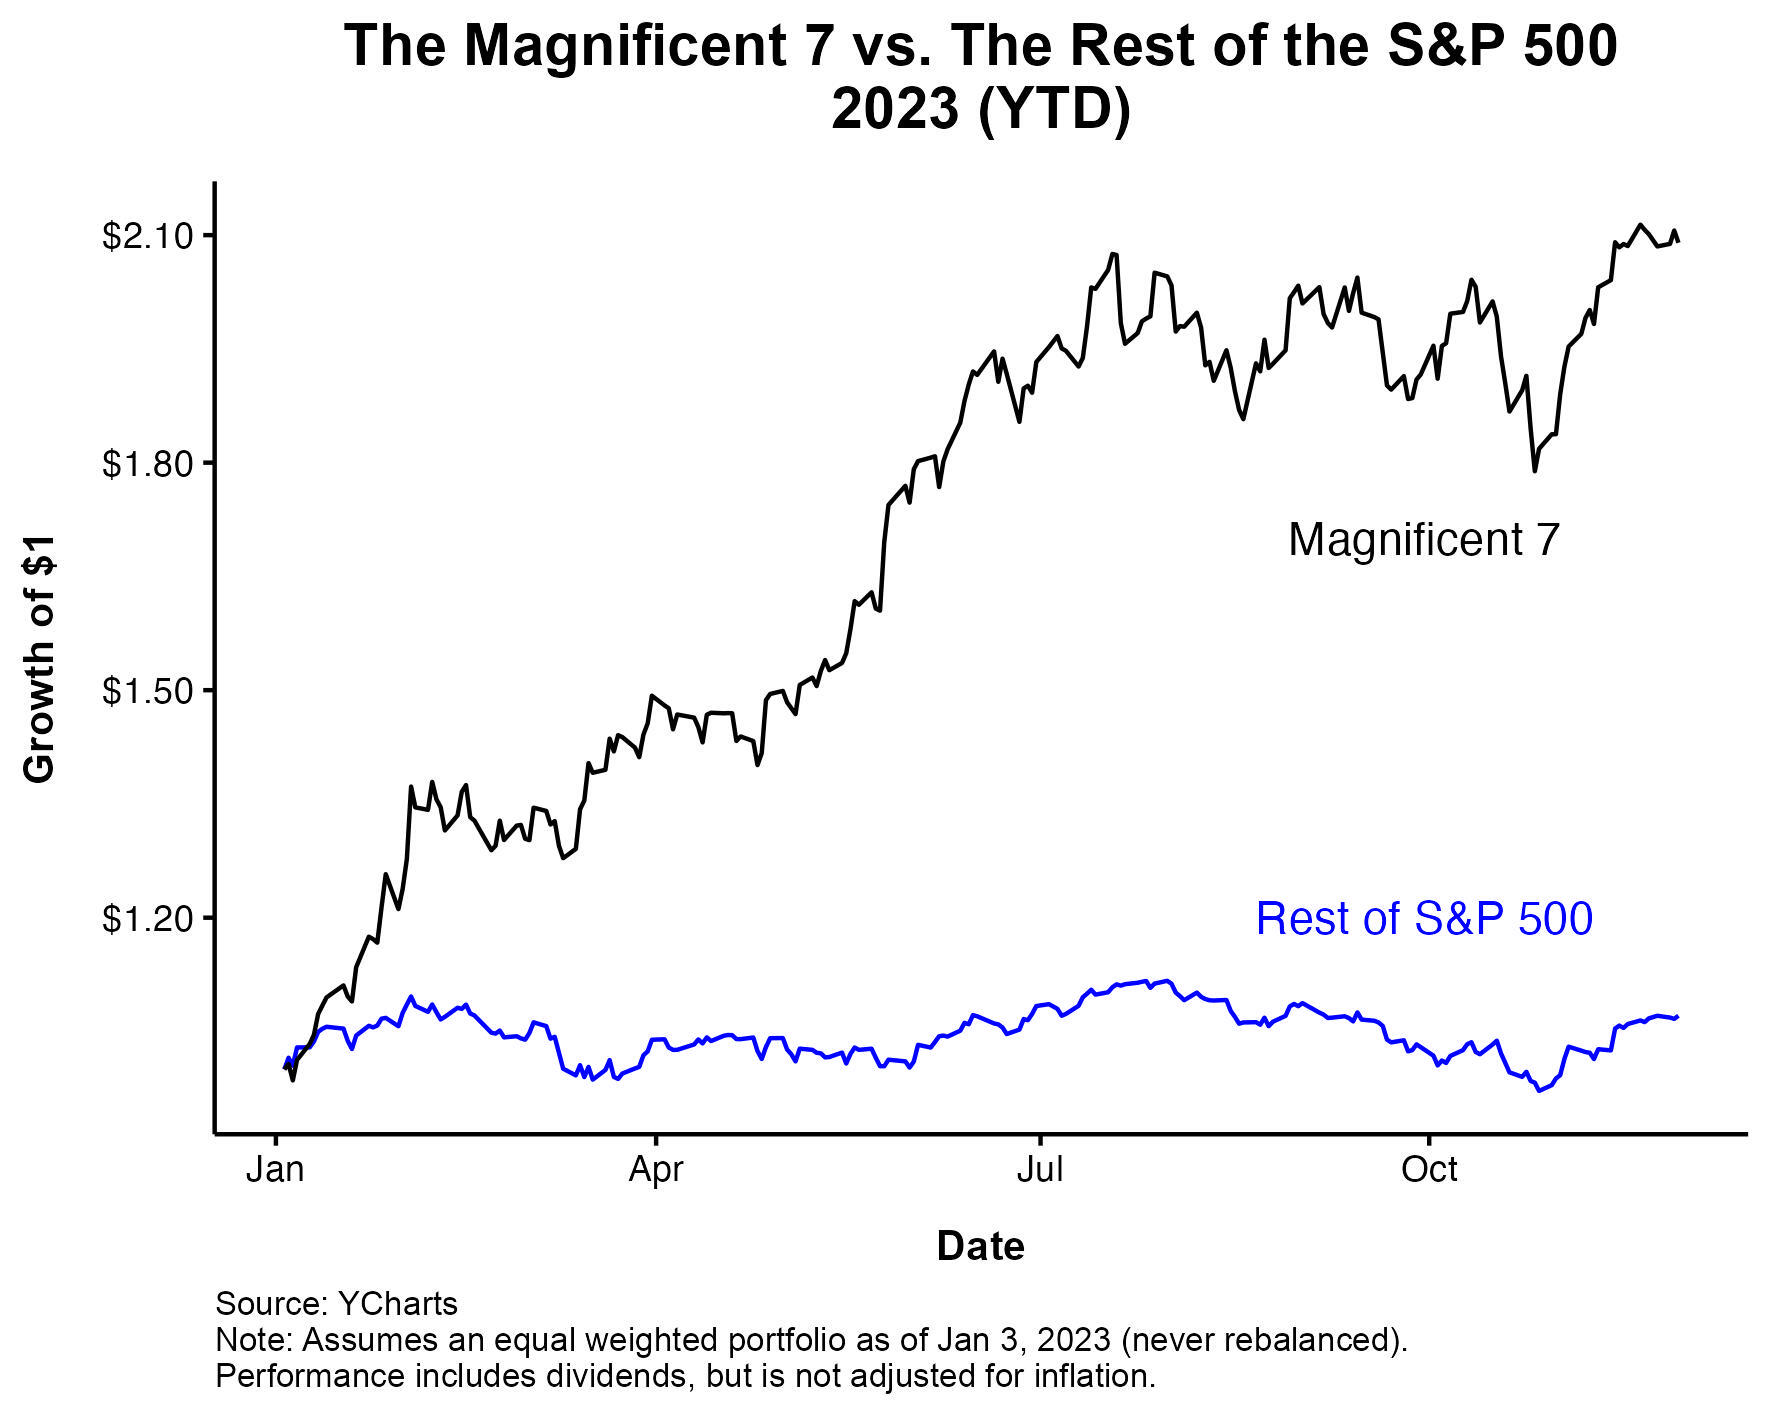
Seven deadly stocks are driving an Andre the Giant-sized hole through the performance of the S&P 500 and the performance of the S&P 493. The magnificent 7 are up 105% year-to-date while the S&P 493 are up just 7%.
This shocking disparity, and I don’t mean to downplay it, is a little less shocking when you zoom out. Mega cap tech got destroyed in 2022. These were some of the peak-to-trough declines:
Google -46%
Amazon -56%
Nvidia -66%
Facebook -77%
An equal-weighted mag 7 portfolio had a 48% drawdown in 2022 that bottomed two days before the new year. So not to take anything away from the impressive run, but you can’t talk about 2023 without looking at 2022. Over the last two years, the magnificent 7 has barely beaten the S&P 500.
The question going forward is, is this bad? Like, what follows narrow leadership? Historically, it’s not great. The next chart shows previous periods of extreme outperformance of the cap-weighted index over the equal-weighted one. 1973, 1990, 1999, 2020, and now today. Yikes.
Only four previous examples of this hardly provides us with any conclusive evidence, but nonetheless I thought this was interesting. The chart below shows a better depiction of 1-year forward S&P 500 returns (in red) following a year of narrowing leadership. Not great, not all bad either.
Josh and I covered this and much more on an incredible episode of The Compound & Friends with the brilliant Dr. David Kelly of JP Morgan.
Michael Batnick is a managing partner at Ritholtz Wealth Management. He is the co-host of Animal Spirits, What Are Your Thoughts, and The Compound and Friends. For disclosure information please see here.
Get a Full Investor Curriculum: Join The Book List
Every month you'll receive 3-4 book suggestions--chosen by hand from more than 1,000 books. You'll also receive an extensive curriculum (books, articles, papers, videos) in PDF form right away.