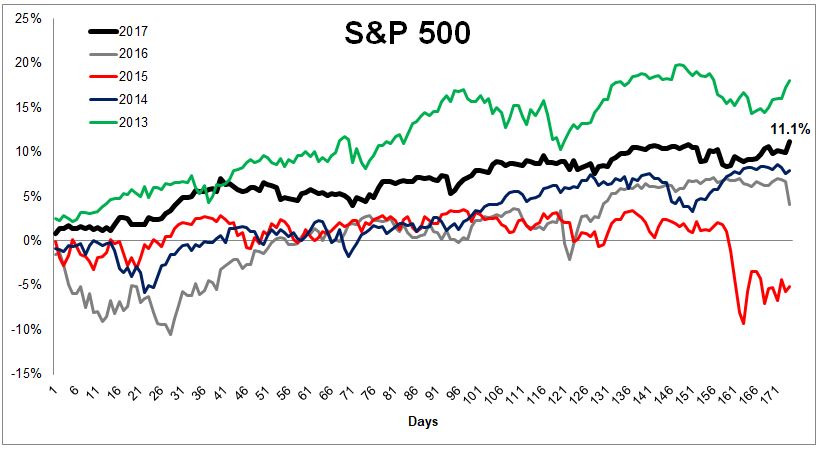
This morning, the S&P 500 is making its 31st all-time high this year. That’s one every 5.6 days, on average.
The index is up 11.1% over the first 174 days of 2017, which is the strongest year-to-date performance through this time since 2013.
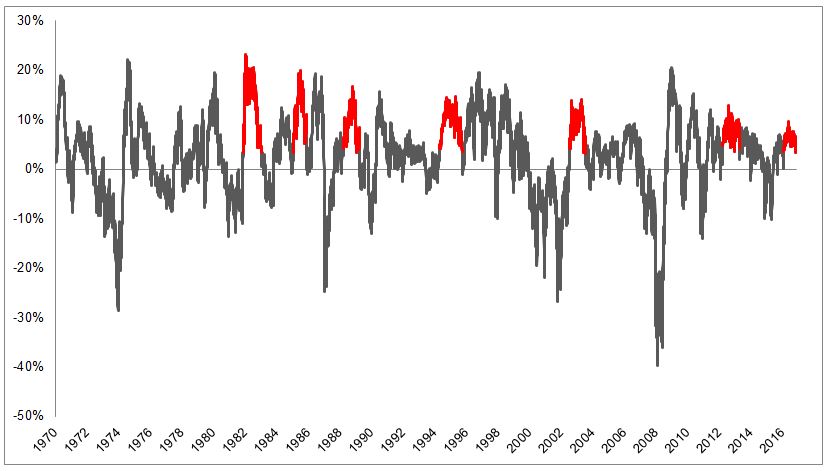
The S&P 500 has been above the 200-day moving average for 304 days, going back to last June. What’s incredible about this streak is that it hasn’t even come close to testing its 200-day. It has been more than 3% above it, an arbitrary number, for 210 straight days. This is just the seventh time since 1970 that stocks have experienced a stretch like this.
The chart below shows the S&P 500 relative to its 200-day in gray, with the other 6 instances of elevated readings highlighted in red.
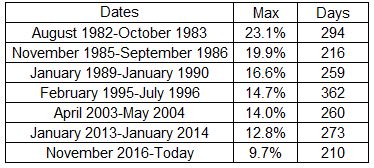
What’s somewhat noteworthy about the current streak is that at no point was the S&P 500 more than 10% above the 200-day, which happened in each of the previous six occurrences. In other words, stocks have been elevated for a while, but never got terribly extended.
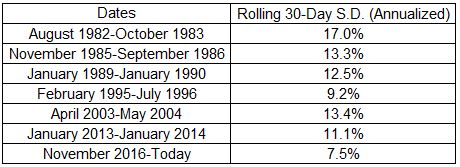
What also makes today interesting is how quiet it is. It feels weird to be hanging around all-time highs without much movement in either direction. The chart below shows the rolling 30-day standard deviation for the S&P 500. The red areas show the six previous times when stocks were extended above their 200-day moving average.
Below is the information from the chart thrown into a table.
What does all this mean? Stocks are elevated but they’re not moving very much, which probably could have been a tweet, but I always say most tweets should be blog posts.
Michael Batnick is a managing partner at Ritholtz Wealth Management. He is the co-host of Animal Spirits, What Are Your Thoughts, and The Compound and Friends. For disclosure information please see here.
Get a Full Investor Curriculum: Join The Book List
Every month you'll receive 3-4 book suggestions--chosen by hand from more than 1,000 books. You'll also receive an extensive curriculum (books, articles, papers, videos) in PDF form right away.

 What does all this mean? Stocks are elevated but they’re not moving very much, which probably could have been a tweet, but I always say most tweets should be blog posts.
